Where are we currently?
The initial version of the Gantt chart module was created as a basic tool for project scheduling and task tracking. However, it proved insufficient to handle the complexities of large-scale construction projects.
What We Learned from Our End Users
Field studies revealed critical limitations, including challenges in managing task dependencies, ensuring accountability, and providing real-time updates necessary for effective decision - making.

Project Managers
I struggle to visualize how
delays in one task affect the rest
of the project. Dependencies are
often unclear, and it’s difficult to
identify critical paths.
Project Managers
Updates come too late for
effective resource reallocation. I
need to make decisions based
on current progress, not
yesterday’s data.
Site Supervisors
I spend too much time
explaining on-site updates to
the office team. There’s no
central platform for real-time
communication
Contractors
I need a simple way to log
progress and report issues
directly from the site. Current
tools are too complex and time-
consuming.
Contractors
I often face resource shortages
or equipment delays but lack a
clear way to communicate
these issues quickly to the
management team.
Sub-Contractors
I don’t always have visibility into
how my tasks depend on others,
which makes it hard to adjust
when delays occur.
What did the business say?
Business Goal 01
Reduce delays and
downtime with instant
task updates.
Business Goal 02:
Keep timelines on track by
visualizing dependencies.
Business Goal 03:
Minimize waste through
optimized resource
allocation.
Business Goal 04:
Enhance accountability to
avoid budget overruns.
Business Goal 05:
Identify risks early to
prevent costly setbacks.
Business Goal 06:
Eliminate
miscommunication to
save time and money.
So what features we needed apart from these competitors and address the overlap of goal and user needs ?
Real-Time Constraint, Downtime,
and Issue Tracking
Unplanned Task Integration
Construction-Specific Gantt
Chart with Work Breakdown
Structure
Dynamic Critical Path
Recalculations
Construction-Specific Progress
Tracking
Real-Time Updates from Field
Reporting
Study and Planing
Secondary research
Source: Equipment Utilization Report, Building Research
Association of New Zealand (BRANZ), 2017.
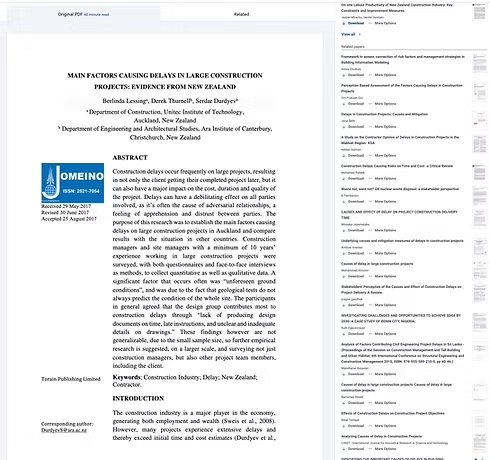
Source: Department of Construction, Unitec Institute of
Technology, Auckland, NZ
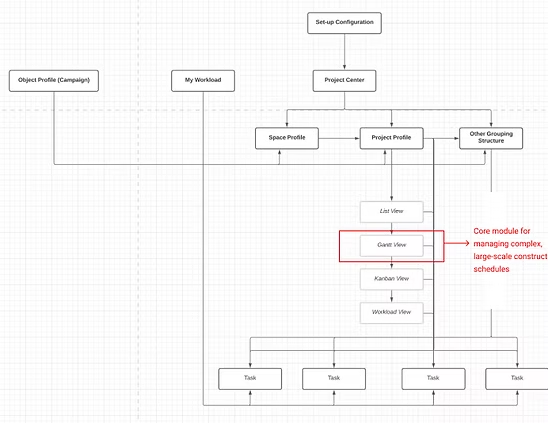
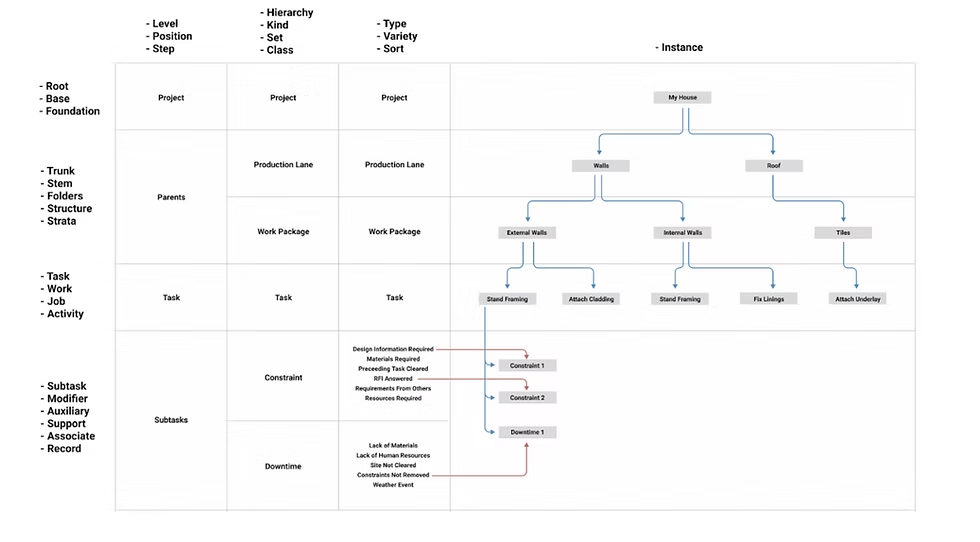
What Are the Challenges in Managing Work Breakdown Structures for
Complex Projects?
Managing WBS involves navigating multi-level hierarchies, dynamic task transitions, scalability
across levels, and system constraints that balance flexibility with structural consistency.
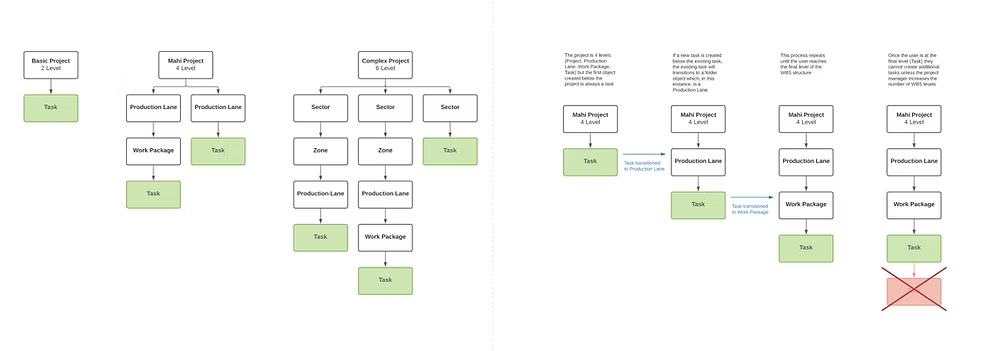
How Does the Work Breakdown Structure Address Construction Challenges?
Managing WBS involves navigating multi-level hierarchies, dynamic task transitions, scalability
across levels, and system constraints that balance flexibility with structural consistency.
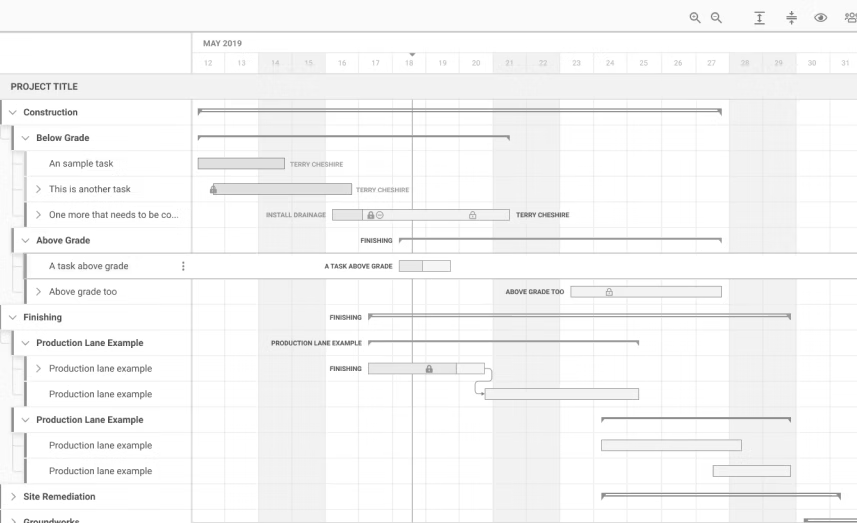
How Did Wireframing Bridge Insights to a User-Centered Gantt Chart?
Insights from field studies and competitor research were translated into designs addressing
construction management challenges, creating a blueprint for a Gantt chart module focused on
task tracking, constraint reporting, and real-time updates.
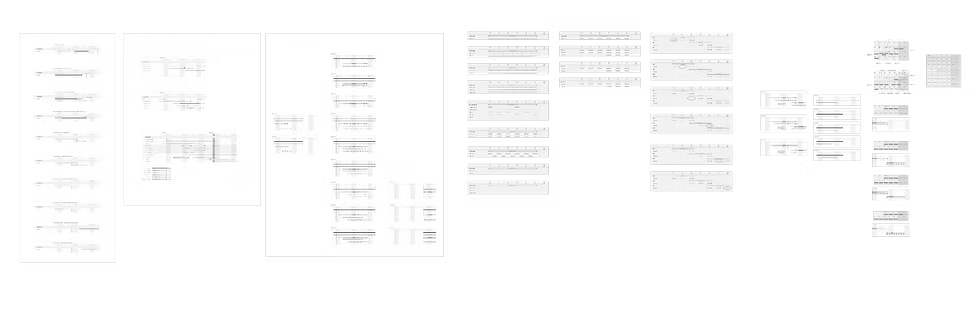
Uncovering Multiple Scenarios for Real-Time Visualization
Schedules and real-time info visualization on the Gantt timeline were explored, distilling insights
and identifying assumptions to address these findings.
Outcome
Implementing real-time reporting tools in construction projects has significantly enhanced
efficiency and reduced delays.
For instance, a highway construction project that adopted a project management tool
experienced a 30% reduction in reporting time, leading to quicker decision-making and fewer
delays.
Generis Online
Additionally, real-time reporting fosters seamless communication among on-site teams and office staff, ensuring that potential issues are addressed promptly, thereby minimizing downtime and improving overall project performance.
These solutions transforms on-site reporting into a streamlined, precise process, keeping projects
on track and teams aligned.
Overall Workflow Efficiency: Increased by 65%.
Communication Accuracy and Speed: Achieved a 30% reduction in
reporting time with improved accuracy.
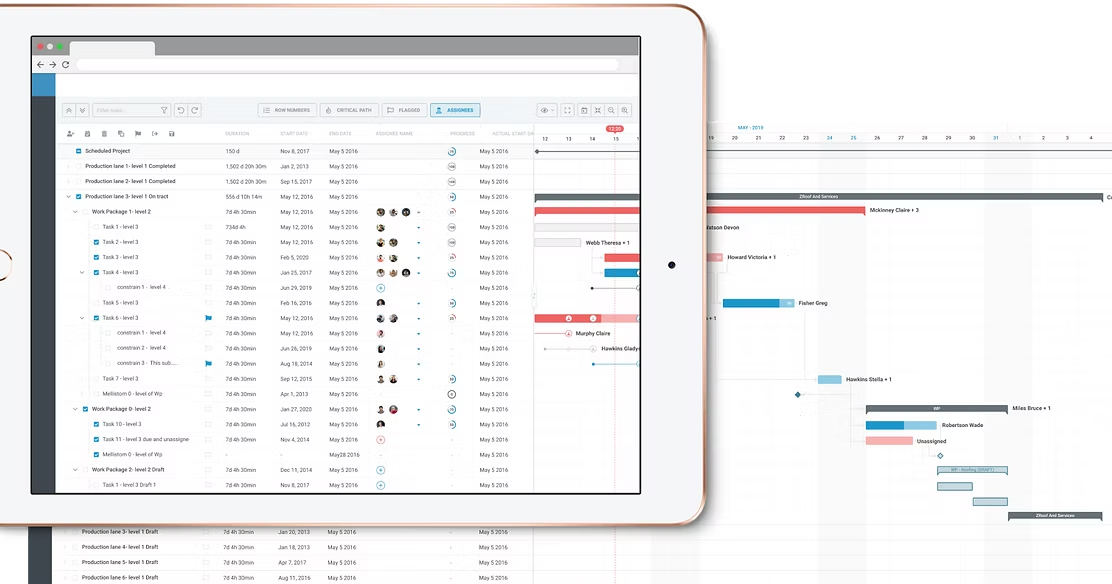
How Can Gantt Charts Streamline Management for Efficient Project
Planning?


Where are we currently?
The initial version of the Gantt chart module was created as a basic tool for project scheduling and task tracking. However, it proved insufficient to handle the complexities of large-scale construction projects.
What We Learned from Our End Users
Field studies revealed critical limitations, including challenges in managing task dependencies, ensuring accountability, and providing real-time updates necessary for effective decision - making.
Project Managers
I struggle to visualize how
delays in one task affect the rest
of the project. Dependencies are
often unclear, and it’s difficult to
identify critical paths.
Project Managers
Updates come too late for
effective resource reallocation. I
need to make decisions based
on current progress, not
yesterday’s data.
Site Supervisors
I spend too much time
explaining on-site updates to
the office team. There’s no
central platform for real-time
communication
Contractors
I need a simple way to log
progress and report issues
directly from the site. Current
tools are too complex and time-
consuming.
Contractors
I often face resource shortages
or equipment delays but lack a
clear way to communicate
these issues quickly to the
management team.
Sub-Contractors
I don’t always have visibility into
how my tasks depend on others,
which makes it hard to adjust
when delays occur.
What did the business say?
Business Goal 01
Reduce delays and
downtime with instant
task updates.
Business Goal 02:
Keep timelines on track by
visualizing dependencies.
Business Goal 03:
Minimize waste through
optimized resource
allocation.
Business Goal 04:
Enhance accountability to
avoid budget overruns.
Business Goal 05:
Identify risks early to
prevent costly setbacks.
Business Goal 06:
Eliminate
miscommunication to
save time and money.
So what features we needed apart from these competitors and address the overlap of goal and user needs ?
Real-Time Constraint, Downtime,
and Issue Tracking
Unplanned Task Integration
Construction-Specific Gantt
Chart with Work Breakdown
Structure
Dynamic Critical Path
Recalculations
Construction-Specific Progress
Tracking
Real-Time Updates from Field
Reporting
Study and Planing
Secondary research
Source: Equipment Utilization Report, Building Research
Association of New Zealand (BRANZ), 2017.
Source: Department of Construction, Unitec Institute of
Technology, Auckland, NZ
What Are the Challenges in Managing Work Breakdown Structures for
Complex Projects?
Managing WBS involves navigating multi-level hierarchies, dynamic task transitions, scalability
across levels, and system constraints that balance flexibility with structural consistency.
How Does the Work Breakdown Structure Address Construction Challenges?
Managing WBS involves navigating multi-level hierarchies, dynamic task transitions, scalability
across levels, and system constraints that balance flexibility with structural consistency.
How Did Wireframing Bridge Insights to a User-Centered Gantt Chart?
Insights from field studies and competitor research were translated into designs addressing
construction management challenges, creating a blueprint for a Gantt chart module focused on
task tracking, constraint reporting, and real-time updates.
Uncovering Multiple Scenarios for Real-Time Visualization
Schedules and real-time info visualization on the Gantt timeline were explored, distilling insights
and identifying assumptions to address these findings.
Outcome
Implementing real-time reporting tools in construction projects has significantly enhanced
efficiency and reduced delays.
For instance, a highway construction project that adopted a project management tool
experienced a 30% reduction in reporting time, leading to quicker decision-making and fewer
delays.
Generis Online
Additionally, real-time reporting fosters seamless communication among on-site teams and office staff, ensuring that potential issues are addressed promptly, thereby minimizing downtime and improving overall project performance.
These solutions transforms on-site reporting into a streamlined, precise process, keeping projects
on track and teams aligned.
Overall Workflow Efficiency: Increased by 65%.
Communication Accuracy and Speed: Achieved a 30% reduction in
reporting time with improved accuracy.
How Can Gantt Charts Streamline Management for Efficient Project
Planning?

Product Design
Playground
Hi I’m Karen
Where are we currently?
The initial version of the Gantt chart module was created as a basic tool for project scheduling and task tracking. However, it proved insufficient to handle the complexities of large-scale construction projects.
What We Learned from Our End Users
Field studies revealed critical limitations, including challenges in managing task dependencies, ensuring accountability, and providing real-time updates necessary for effective decision - making.
Project Managers
I struggle to visualize how
delays in one task affect the rest
of the project. Dependencies are
often unclear, and it’s difficult to
identify critical paths.
Project Managers
Updates come too late for
effective resource reallocation. I
need to make decisions based
on current progress, not
yesterday’s data.
Site Supervisors
I spend too much time
explaining on-site updates to
the office team. There’s no
central platform for real-time
communication
Contractors
I need a simple way to log
progress and report issues
directly from the site. Current
tools are too complex and time-
consuming.
Contractors
I often face resource shortages
or equipment delays but lack a
clear way to communicate
these issues quickly to the
management team.
Sub-Contractors
I don’t always have visibility into
how my tasks depend on others,
which makes it hard to adjust
when delays occur.
What did the business say?
Business Goal 01
Reduce delays and
downtime with instant
task updates.
Business Goal 02:
Keep timelines on track by
visualizing dependencies.
Business Goal 03:
Minimize waste through
optimized resource
allocation.
Business Goal 04:
Enhance accountability to
avoid budget overruns.
Business Goal 05:
Identify risks early to
prevent costly setbacks.
Business Goal 06:
Eliminate
miscommunication to
save time and money.
So what features we needed apart from these competitors and address the overlap of goal and user needs ?
Real-Time Constraint, Downtime,
and Issue Tracking
Unplanned Task Integration
Construction-Specific Gantt
Chart with Work Breakdown
Structure
Dynamic Critical Path
Recalculations
Construction-Specific Progress
Tracking
Real-Time Updates from Field
Reporting
Study and Planing
Secondary research
Source: Equipment Utilization Report, Building Research
Association of New Zealand (BRANZ), 2017.
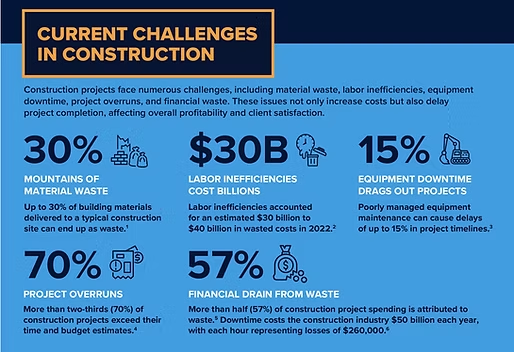
In 2016, a study revealed key challenges
in construction management:
· $50 billion is lost annually due to downtime.
· $260,000 per hour in average downtime costs.
· 70% of projects exceed time and budget.
The document underscores the
necessity of real-time site condition
reporting to
· Mitigate delays caused by slow communication and lack of updates.
· Enhance visibility into project progress, ensuring accountability
and task ownership.
Source: Department of Construction, Unitec Institute of
Technology, Auckland, NZ
What Are the Challenges in Managing Work Breakdown Structures for
Complex Projects?
Managing WBS involves navigating multi-level hierarchies, dynamic task transitions, scalability
across levels, and system constraints that balance flexibility with structural consistency.
How Does the Work Breakdown Structure Address Construction Challenges?
Managing WBS involves navigating multi-level hierarchies, dynamic task transitions, scalability
across levels, and system constraints that balance flexibility with structural consistency.
How Did Wireframing Bridge Insights to a User-Centered Gantt Chart?
Insights from field studies and competitor research were translated into designs addressing
construction management challenges, creating a blueprint for a Gantt chart module focused on
task tracking, constraint reporting, and real-time updates.
Uncovering Multiple Scenarios for Real-Time Visualization
Schedules and real-time info visualization on the Gantt timeline were explored, distilling insights
and identifying assumptions to address these findings.
Outcome
Implementing real-time reporting tools in construction projects has significantly enhanced
efficiency and reduced delays.
For instance, a highway construction project that adopted a project management tool
experienced a 30% reduction in reporting time, leading to quicker decision-making and fewer
delays.
Generis Online
Additionally, real-time reporting fosters seamless communication among on-site teams and
office staff, ensuring that potential issues are addressed promptly, thereby minimizing downtime
and improving overall project performance.
These solutions transforms on-site reporting into a streamlined, precise process, keeping projects
on track and teams aligned.
Overall Workflow Efficiency: Increased by 65%.
Communication Accuracy and Speed: Achieved a 30% reduction in
reporting time with improved accuracy.
How Can Gantt Charts Streamline Management for Efficient Project
Planning?
Product Design
Playground
Hi I’m Karen
Where are we currently?
The initial version of the Gantt chart module was created as a basic tool for project scheduling and task tracking. However, it proved insufficient to handle the complexities of large-scale construction projects.
What We Learned from Our End Users
Field studies revealed critical limitations, including challenges in managing task dependencies, ensuring accountability, and providing real-time updates necessary for effective decision - making.
Project Managers
I struggle to visualize how
delays in one task affect the rest
of the project. Dependencies are
often unclear, and it’s difficult to
identify critical paths.
Project Managers
Updates come too late for
effective resource reallocation. I
need to make decisions based
on current progress, not
yesterday’s data.
Site Supervisors
I spend too much time
explaining on-site updates to
the office team. There’s no
central platform for real-time
communication
Contractors
I need a simple way to log
progress and report issues
directly from the site. Current
tools are too complex and time-
consuming.
Contractors
I often face resource shortages
or equipment delays but lack a
clear way to communicate
these issues quickly to the
management team.
Sub-Contractors
I don’t always have visibility into
how my tasks depend on others,
which makes it hard to adjust
when delays occur.
What did the business say?
Business Goal 01
Reduce delays and
downtime with instant
task updates.
Business Goal 02:
Keep timelines on track by
visualizing dependencies.
Business Goal 03:
Minimize waste through
optimized resource
allocation.
Business Goal 04:
Enhance accountability to
avoid budget overruns.
Business Goal 05:
Identify risks early to
prevent costly setbacks.
Business Goal 06:
Eliminate
miscommunication to
save time and money.
So what features we needed apart from these competitors and address the overlap of goal and user needs ?
Real-Time Constraint, Downtime,
and Issue Tracking
Unplanned Task Integration
Construction-Specific Gantt
Chart with Work Breakdown
Structure
Dynamic Critical Path
Recalculations
Construction-Specific Progress
Tracking
Real-Time Updates from Field
Reporting
Study and Planing
Secondary research
Source: Equipment Utilization Report, Building Research
Association of New Zealand (BRANZ), 2017.
In 2016, a study revealed key challenges
in construction management:
· $50 billion is lost annually due to downtime.
· $260,000 per hour in average downtime costs.
· 70% of projects exceed time and budget.
The document underscores the
necessity of real-time site condition
reporting to
· Mitigate delays caused by slow communication and lack of updates.
· Enhance visibility into project progress, ensuring accountability
and task ownership.
Source: Department of Construction, Unitec Institute of
Technology, Auckland, NZ
What Are the Challenges in Managing Work Breakdown Structures for
Complex Projects?
Managing WBS involves navigating multi-level hierarchies, dynamic task transitions, scalability
across levels, and system constraints that balance flexibility with structural consistency.
How Does the Work Breakdown Structure Address Construction Challenges?
Managing WBS involves navigating multi-level hierarchies, dynamic task transitions, scalability
across levels, and system constraints that balance flexibility with structural consistency.
How Did Wireframing Bridge Insights to a User-Centered Gantt Chart?
Insights from field studies and competitor research were translated into designs addressing
construction management challenges, creating a blueprint for a Gantt chart module focused on
task tracking, constraint reporting, and real-time updates.
Uncovering Multiple Scenarios for Real-Time Visualization
Schedules and real-time info visualization on the Gantt timeline were explored, distilling insights
and identifying assumptions to address these findings.
Outcome
Implementing real-time reporting tools in construction projects has significantly enhanced
efficiency and reduced delays.
For instance, a highway construction project that adopted a project management tool
experienced a 30% reduction in reporting time, leading to quicker decision-making and fewer
delays.
Generis Online
Additionally, real-time reporting fosters seamless communication among on-site teams and
office staff, ensuring that potential issues are addressed promptly, thereby minimizing downtime
and improving overall project performance.
These solutions transforms on-site reporting into a streamlined, precise process, keeping projects
on track and teams aligned.
Overall Workflow Efficiency: Increased by 65%.
Communication Accuracy and Speed: Achieved a 30% reduction in
reporting time with improved accuracy.
How Can Gantt Charts Streamline Management for Efficient Project
Planning?
Product Design
Playground
Hi I’m Karen