Reporting
Why is the Reporting Module Necessary?
The reporting process at Mahi Construction was fragmented and inefficient.
Existing project management tools generated massive amounts of data, but users, including Project Managers, Team Leads, and Compliance Officers struggled to extract clear insights.
This made it difficult to track progress, report constraints, and communicate effectively across teams. As a result, decision-making was delayed, reporting was error-prone, and critical issues often went unresolved on time.
Who Are We Designing For?
The reporting module is for Project Managers, Team Leads, Compliance Officers, and Executives, each with unique needs: tracking progress, monitoring performance, ensuring compliance, and evaluating project health.
Meet Project Manager

Age: 30 - 45
Role: Project Manager in Construction and Operations
Profile:
Manages project timelines, resources, and task performance to keep projects on track.
Pain Points:
- Difficulty consolidating data from multiple modules.
- Limited flexibility with static reports.
- Struggles to extract actionable insights.
- Time-consuming manual reporting.
Meet Team Lead

Age: 28 - 50
Role: Team Supervisor or Shift Manager
Profile:
Oversees team performance, shift schedules, and daily task assignments.
Pain Points:
- Lacks technical skills to generate reports.
- Difficulty monitoring team progress efficiently.
- Challenges in sharing clear performance updates.
- Limited options for customizing team-specific reports.
Meet Compliance Officer

Age: 35 - 50
Role: Compliance and Safety Specialist
Profile:
Ensures projects meet safety standards, regulations, and legal requirements.
Pain Points:
- Struggles to customize compliance reports.
- Tools can’t handle growing compliance data.
- Difficulty identifying risks or trends.
- Inefficient sharing of audit-ready reports.
Meet Executive

Age: 35 - 60
Role: Senior Executive or Decision-Maker
Profile:
Relies on high-level summaries and KPIs to evaluate project performance and make decisions.
Pain Points:
- Difficulty accessing unified project overviews.
- Needs quick, clear insights without digging into data.
- Delays caused by manual reporting processes.
- Reporting tools lack scalability for complex demands.
What was the business saying?
Centralized insights for better decision making
Combine data across modules (Project Management, Shift Allocation, etc.) into a unified, easy-to-access reporting interface.
Save time and reduce manual reporting effort
Automate report generation with templates and real-time updates.
Improve adoption with user-friendly design
Offer a simple report builder for non-technical and advanced users.
Support compliance and transparency
Generate customizable reports to meet regulatory needs.
Enhance scalability and future growth
Start with core features and scale to advanced reporting capabilities.
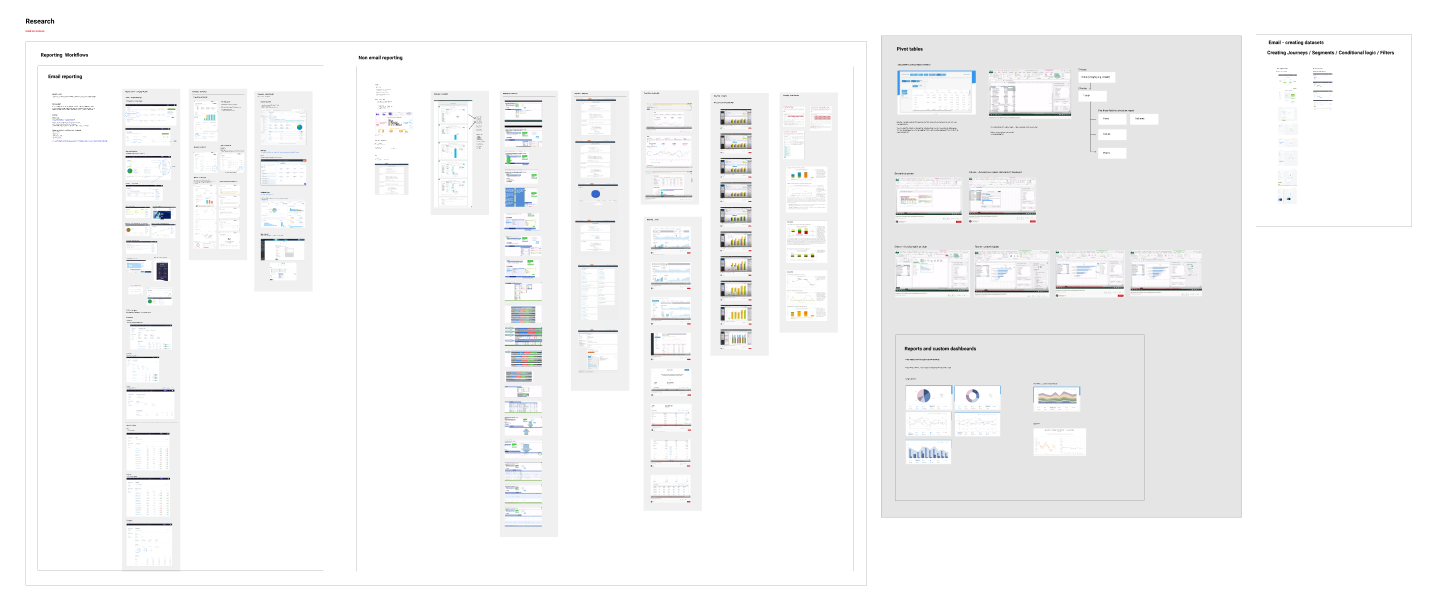
Research and Competitor Analysis: Mapping Goals and Prioritizing Features
The goals of the indirect competitor systems research were to analyze reporting modules and explore functionalities related to data builders.
The findings from this detailed analysis focused on identifying opportunities, mapping goals, and prioritizing features.
This research bridges the gap between end-user needs and business objectives, ensuring the reporting module aligns with both usability and strategic value.
Defining The MVP
Based on competitor research, end-user pain points, and business objectives, we applied the Impact vs. Effort framework to prioritize features. This method helped us identify key design priorities for the MVP and phase out complex features for the future roadmap.
Development Effort
Impact
Hight Impact
Low Impact
Low Effort
High Effort
Execution
Project
A Task
Remove in MVP Phase


External Data Import
Data Layout Designer
Customized Data Visualizations
Conditional formatting
Scheduled Reports
Interactive Chart Drill-Downs
Cross-Module Data Integration
Advanced Filtering and Grouping
Pivot Table Builder
Basic Reporting actions (Save Draft, Preview, Export, Share, Reuse Edit )
Role-Based Access Control
Report Version History
Real-Time Collaboration on Reports
Automated Report Emailing
Embedded Reports for Third-Party Platforms
Real-Time Data Refresh
What Have We Found from Competitors That Can Bridge Business Objectives and End User Needs?
ICRA: Features and Opportunities
- Role-Based Access Control
- Data Layout Designer
- Pivot Table Builder
- Customized Data Visualizations
- Cross-Module Data Integration
- Advanced Filtering and Grouping
- Real-Time Data Refresh
- External Data Import
- Scheduled Reports
- Conditional formatting
- Interactive Chart Drill-Downs
- Basic Reporting actions (Save Draft, Preview, Export, Share, Reuse Edit )
- Report Version History
- Real-Time Collaboration on Reports
- Automated Report Emailing
- Embedded Reports for Third-Party Platforms

Impact vs Effort Prioritization
- Role-Based Access Control
- Custom Data Builder
- Customizable Data Visualizations
- Cross-Module Data Integration
- Advanced Filtering and Grouping
- Real-Time Data Refresh
- Scheduled Reports
- Conditional Formatting
- Interactive Chart Drill-Down
- Basic Reporting Actions

KPI: Final Design Elements
- Create Modal: Data Source, Report Type
- Data Builder: Layout, Settings, Scheduling, Summary, Chart Type Selection, Edit Chart Data, Advanced Data Filtering
- Report Preview
- Publish Modal: Summary, Scheduling, Distribution, Sharing & Invitations
- Report Imprint
- Report Status: Draft, Active, Archived
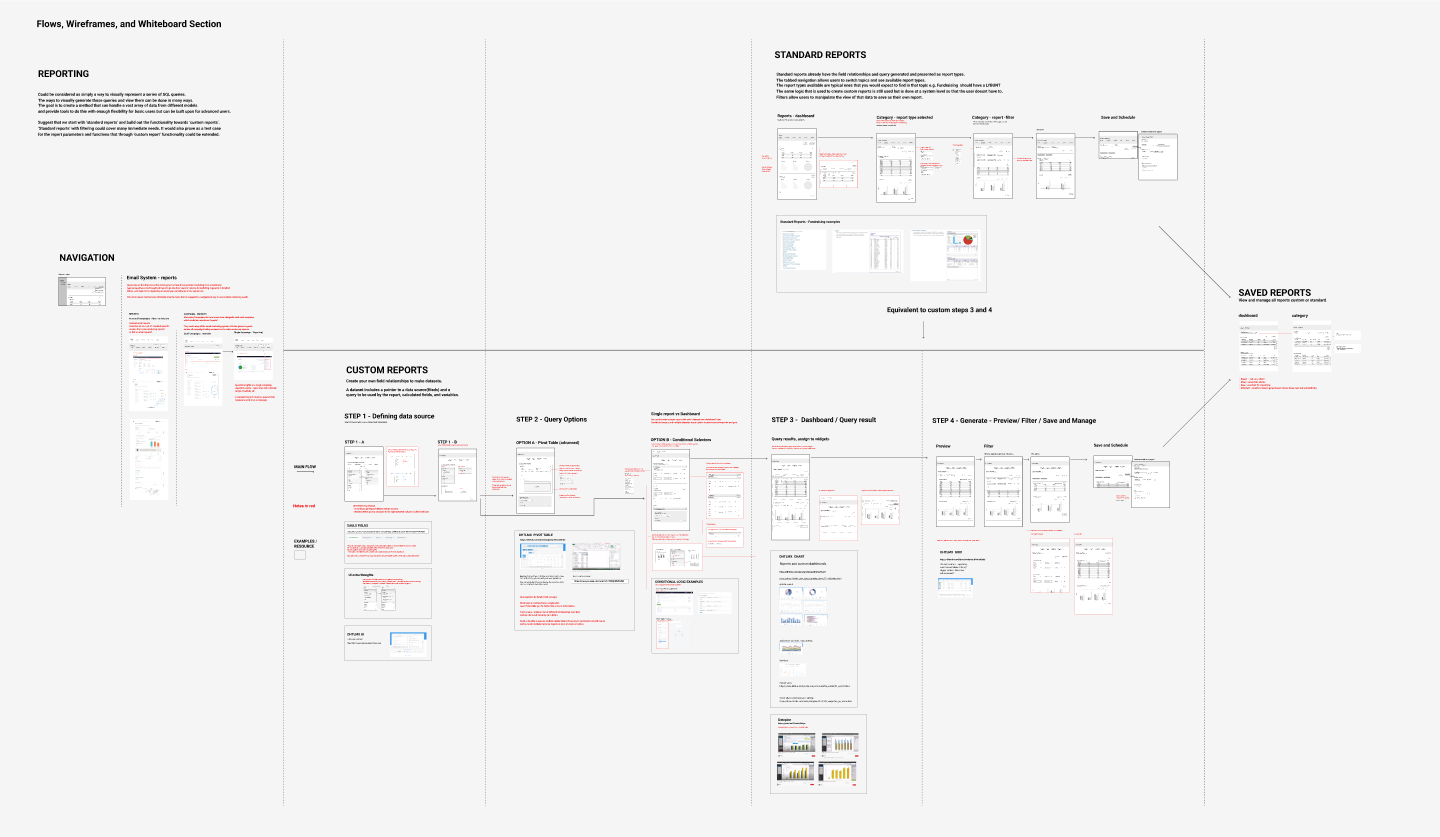
Flows, Wireframes, and Whiteboard Section
We started with a high-level Information Architecture (IA) to establish the reporting module's structure, followed by developing user journeys to map the experience across key tasks.This was supported by a dynamic process that combined user flows, detailed wireframes, and notes for feature logic.
The result bridges the gap between flowcharts and wireframes, documenting feature behaviors, user interactions, and logical connections.
This approach ensures a clear, seamless, and intuitive experience for users as they navigate through report creation, customization, and management.
Access Management (Inventory)


Project Managers
Executives

Construction Team Leaders

Compliance Officers
Login
(Azure Active Directory Azure AD )


Reports Center
Planner (Gant Chart)


Create Report
Define data source
Select report type
General
Global
Targeted
Chart types
Data Editor
Date range
Report Description
Report Name
Report Layout
Save and Scheduling
Data Builder
Drag-and-drop layout builder
Chart customization options
Advanced filtering tools
Scheduling options for reports
Summary view of report content
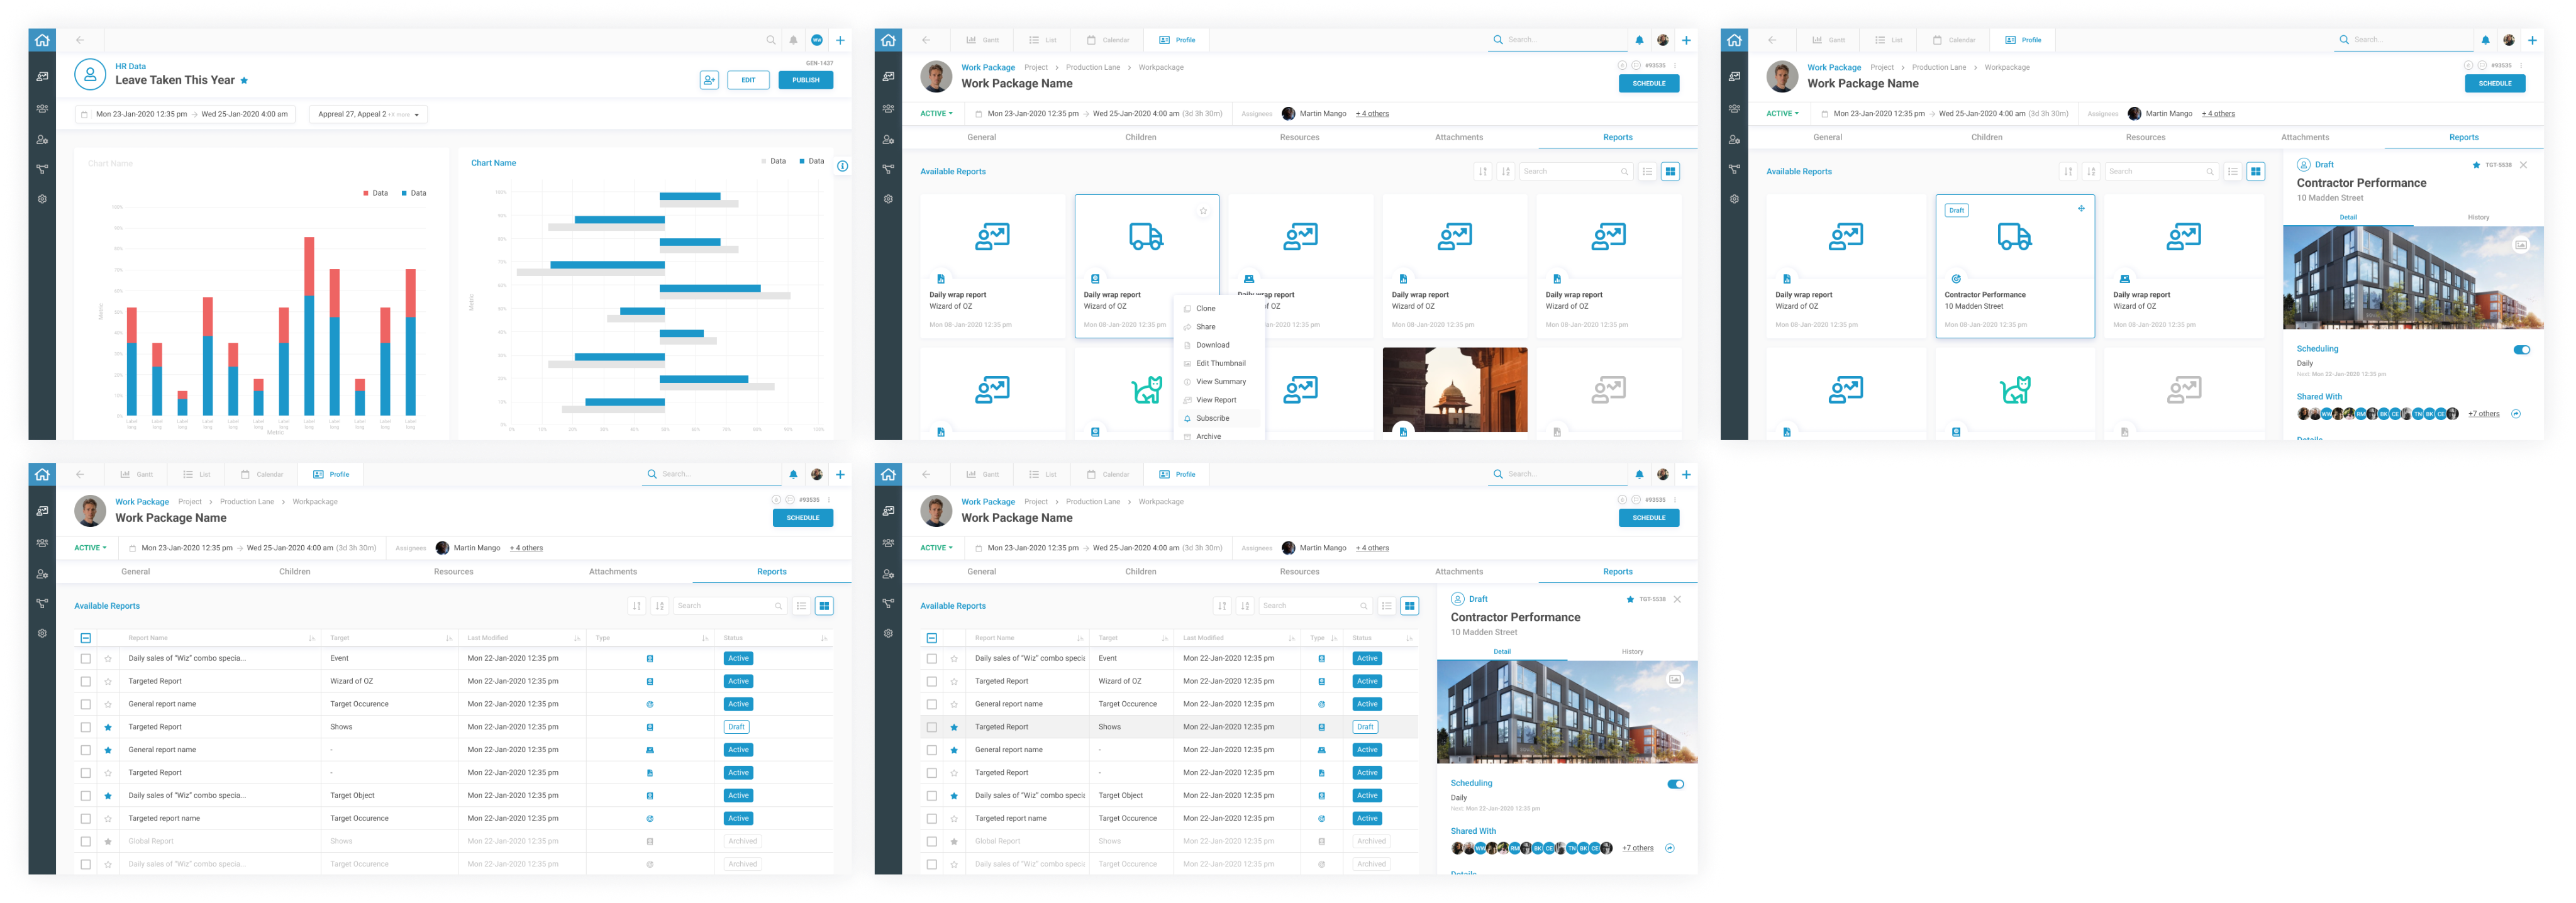
Report Preview
Finalized look at report sections and charts
Direct adjustments from preview
Publish Modal
Finalize report distribution
Summary confirmation before publishing
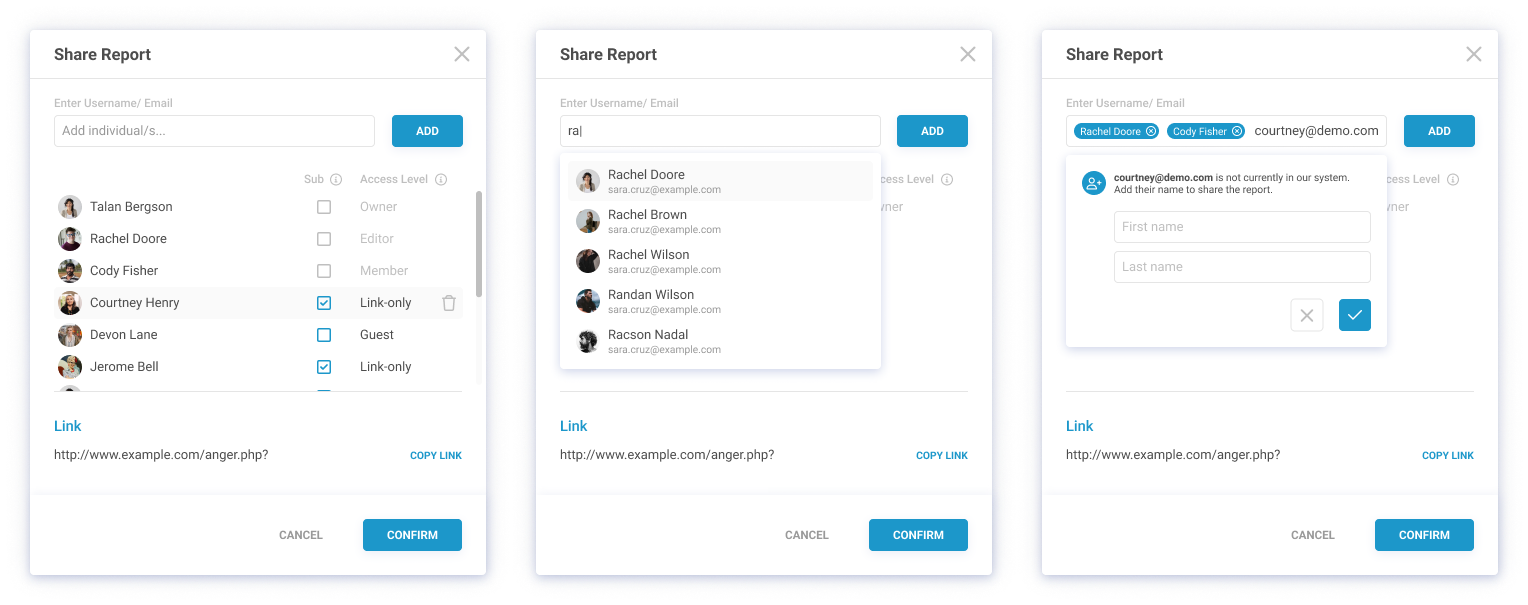
Recipient management for report sharing
Recipient management for report sharing
Options for export formats (PDF/Excel)
Options for export formats (PDF/Excel)
Sending invitations for collaboration
Report Imprint
Customize logos and headers
Add metadata (date, author, version history)
Report Status Management
Categorize reports (Draft, Active, Archived)
Manage accessibility of each report status


UI and Hi-Fi design
Create Modal: Data Source, Report Type
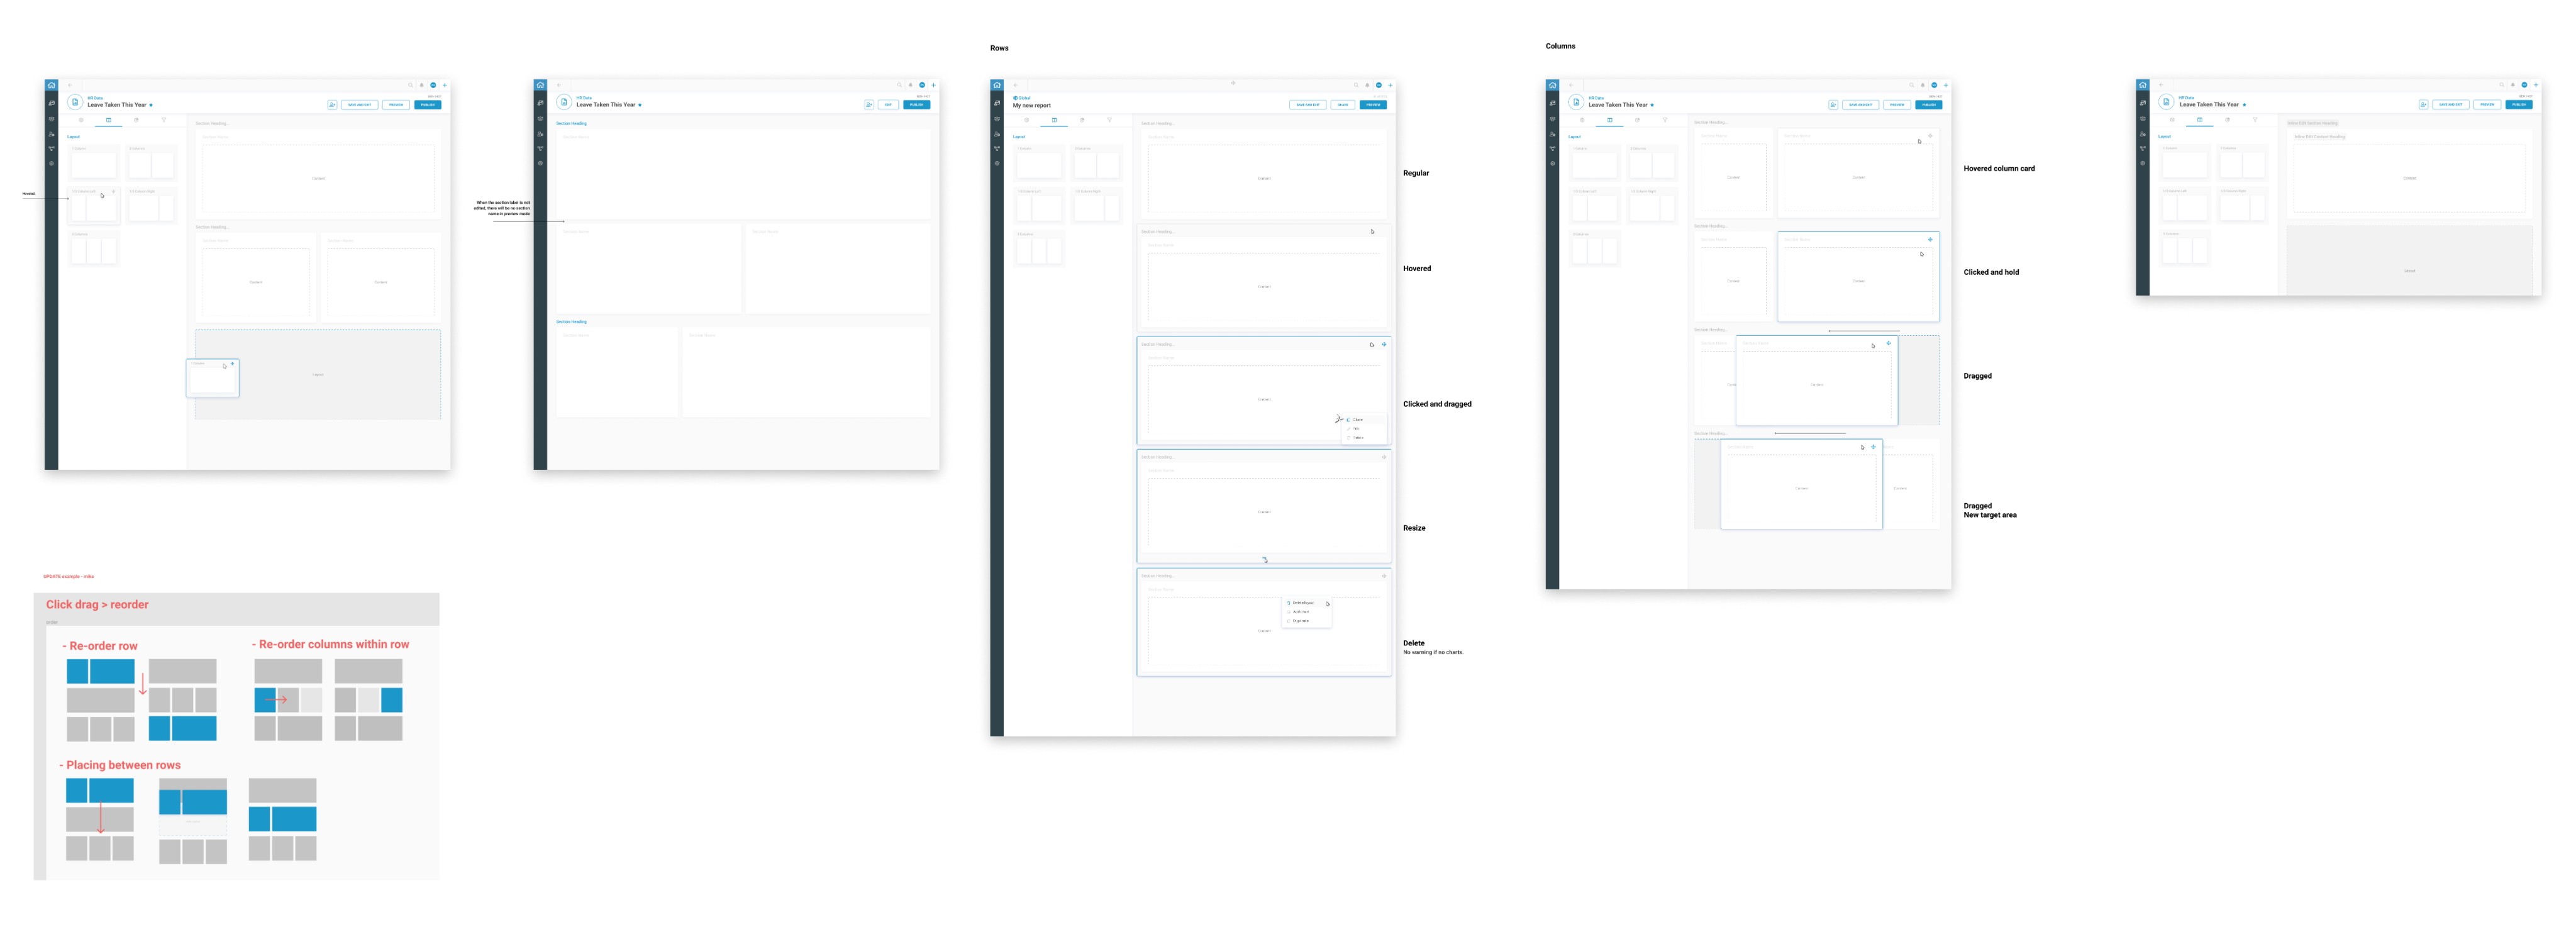
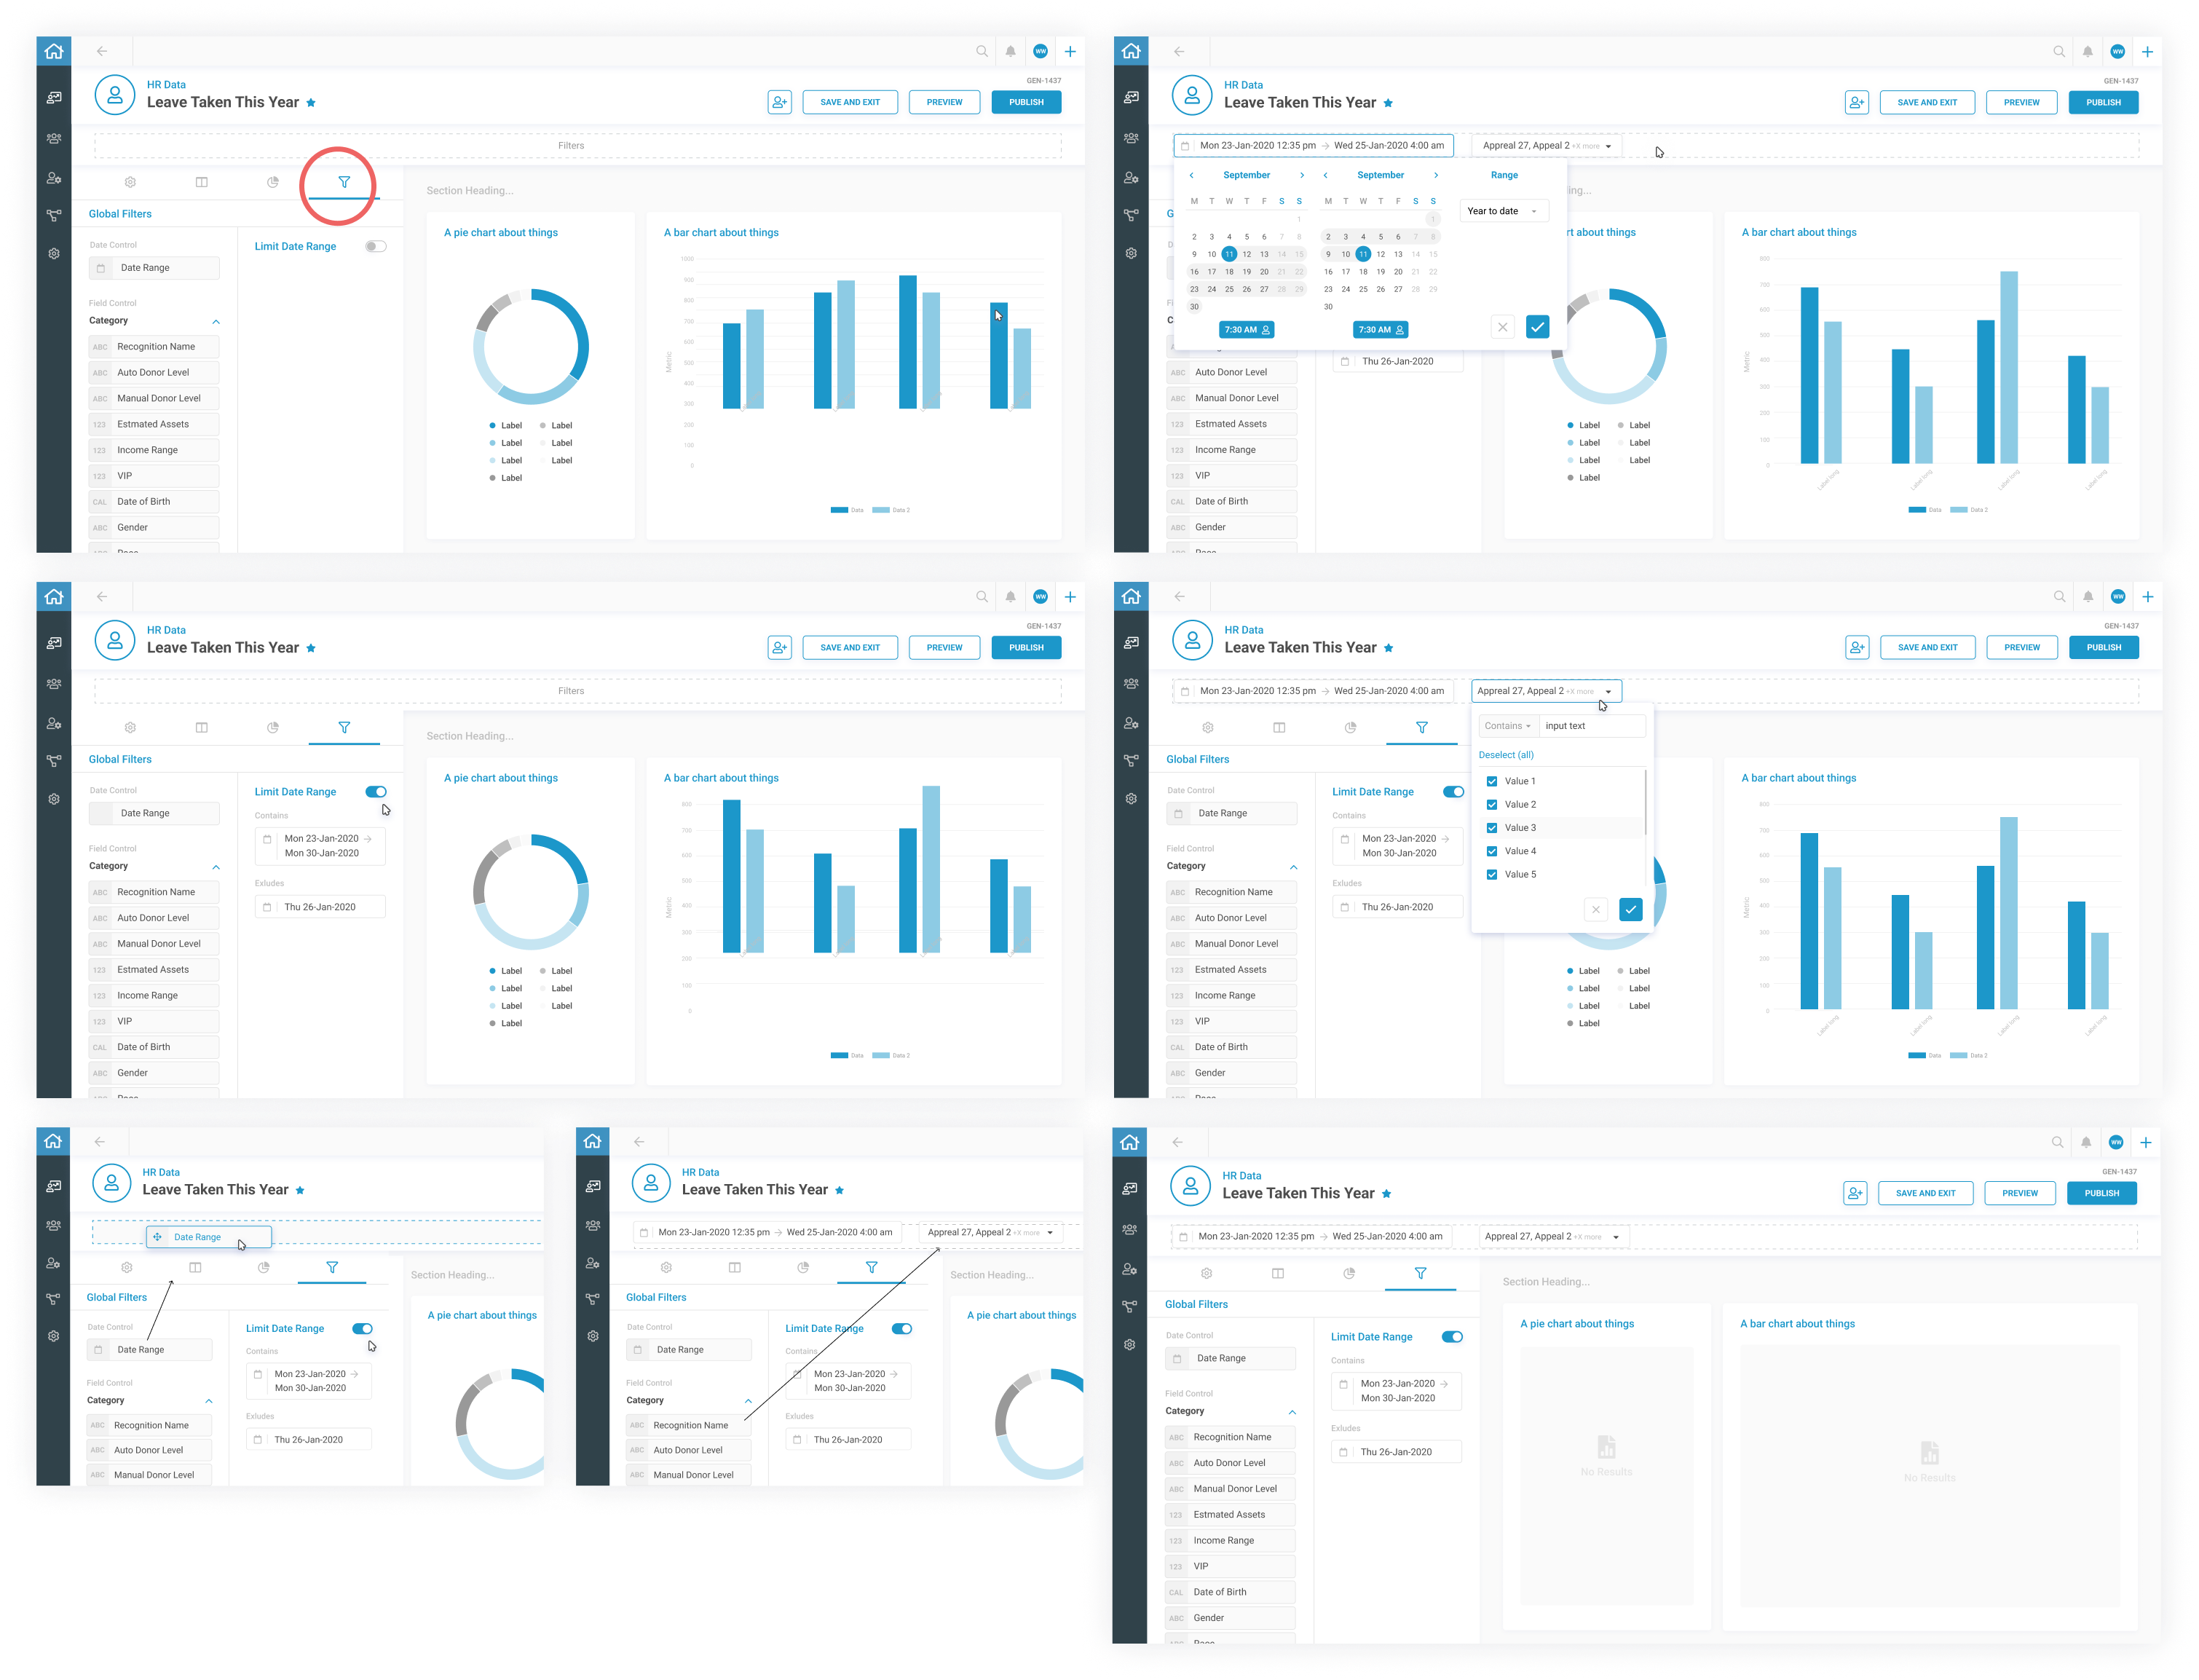
Data Builder: Layout
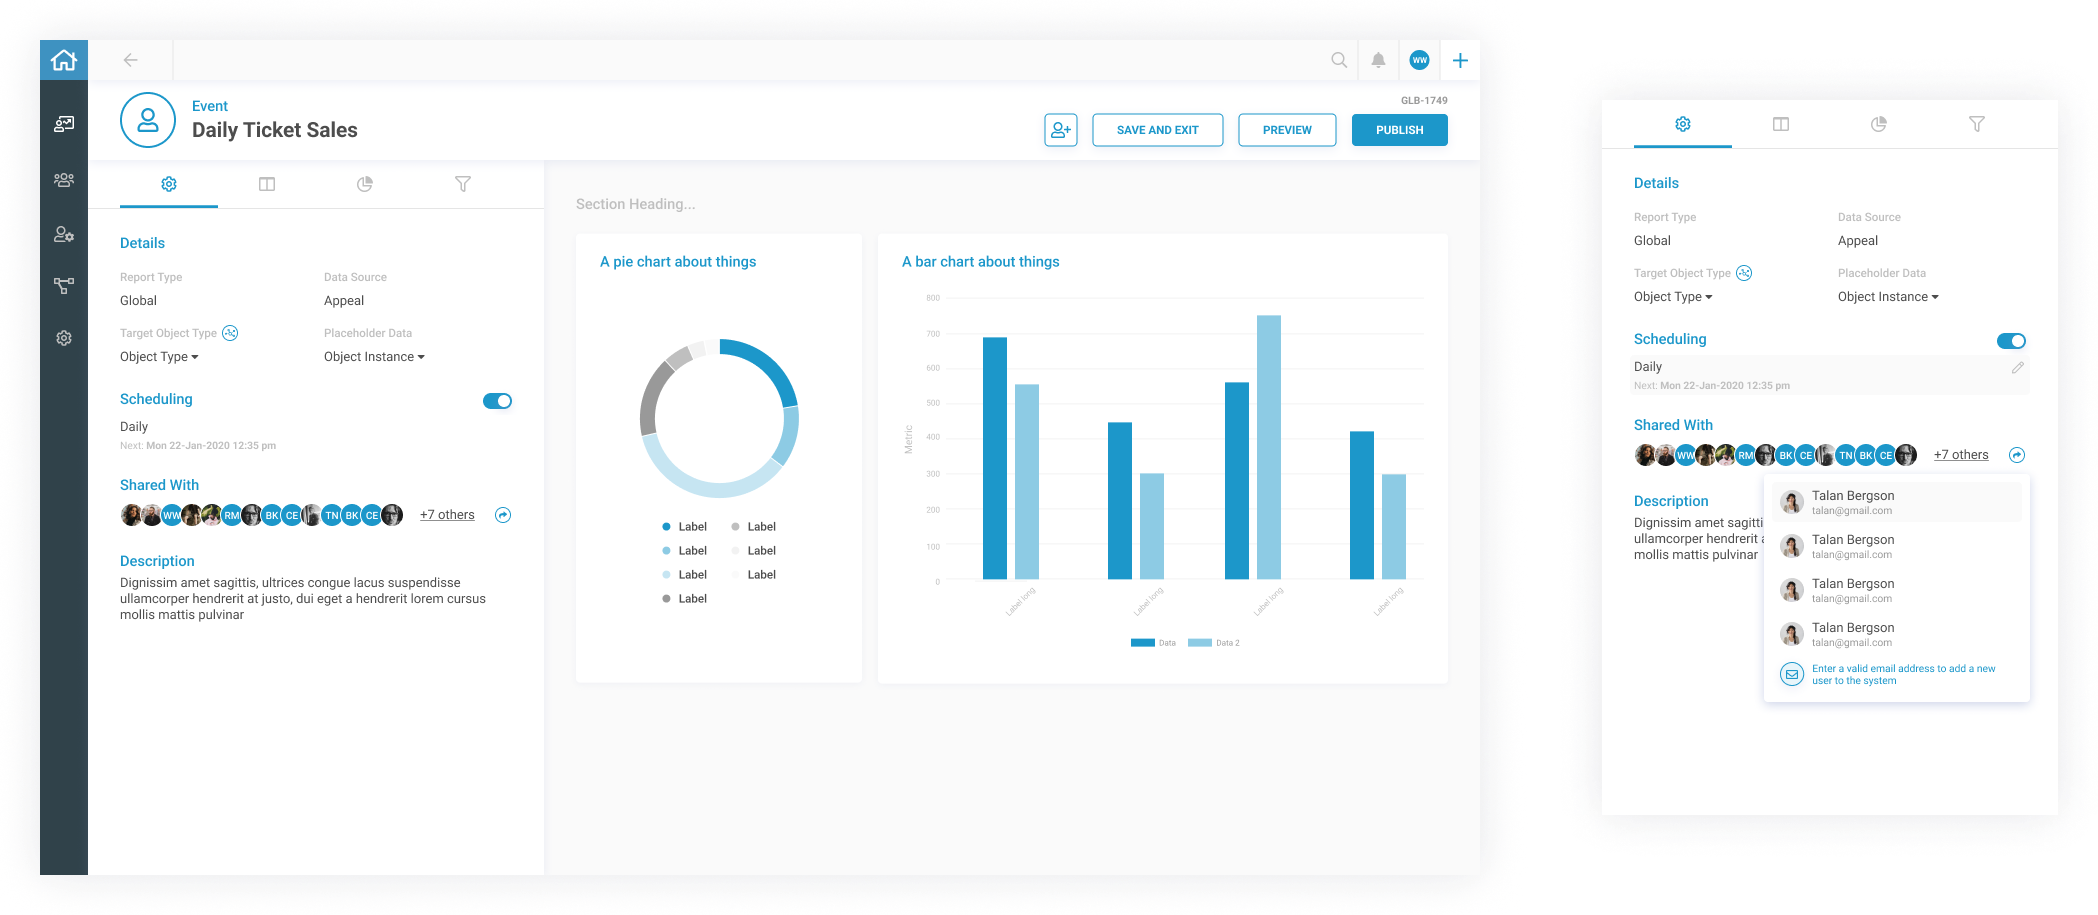
Data Builder: Settings, Scheduling, and Summary
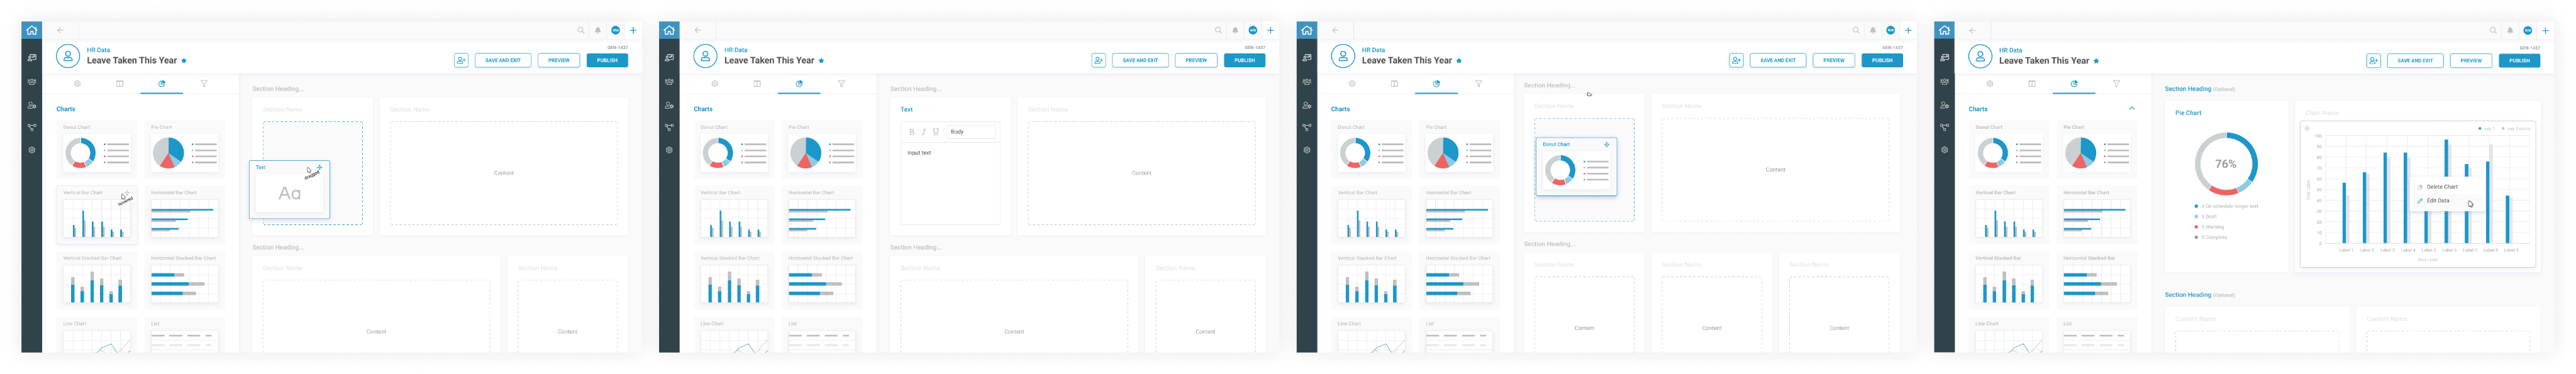
Data Builder: Data Chart Type Selection
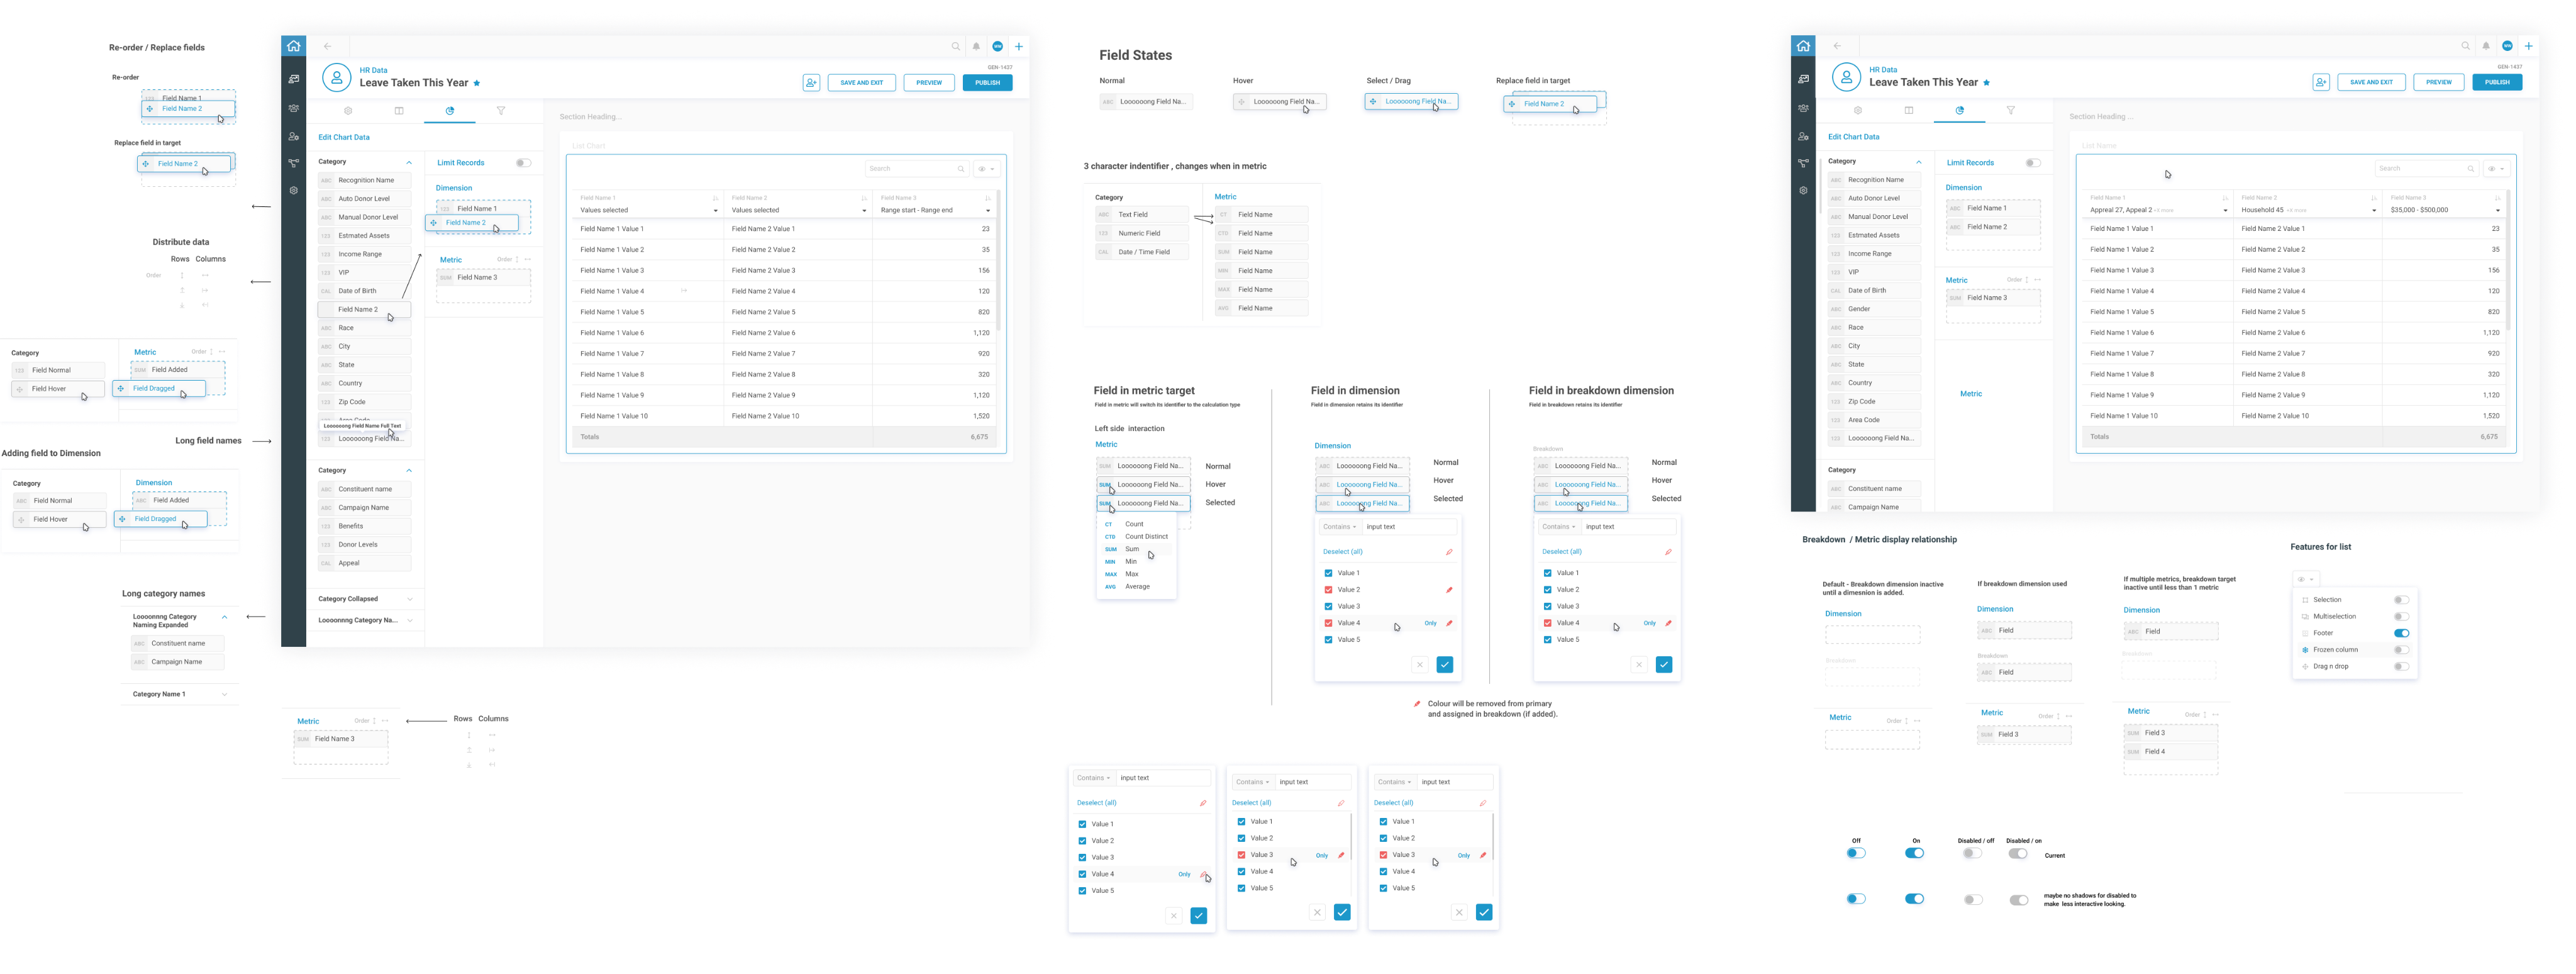
Data Builder: Advance Data Filtering
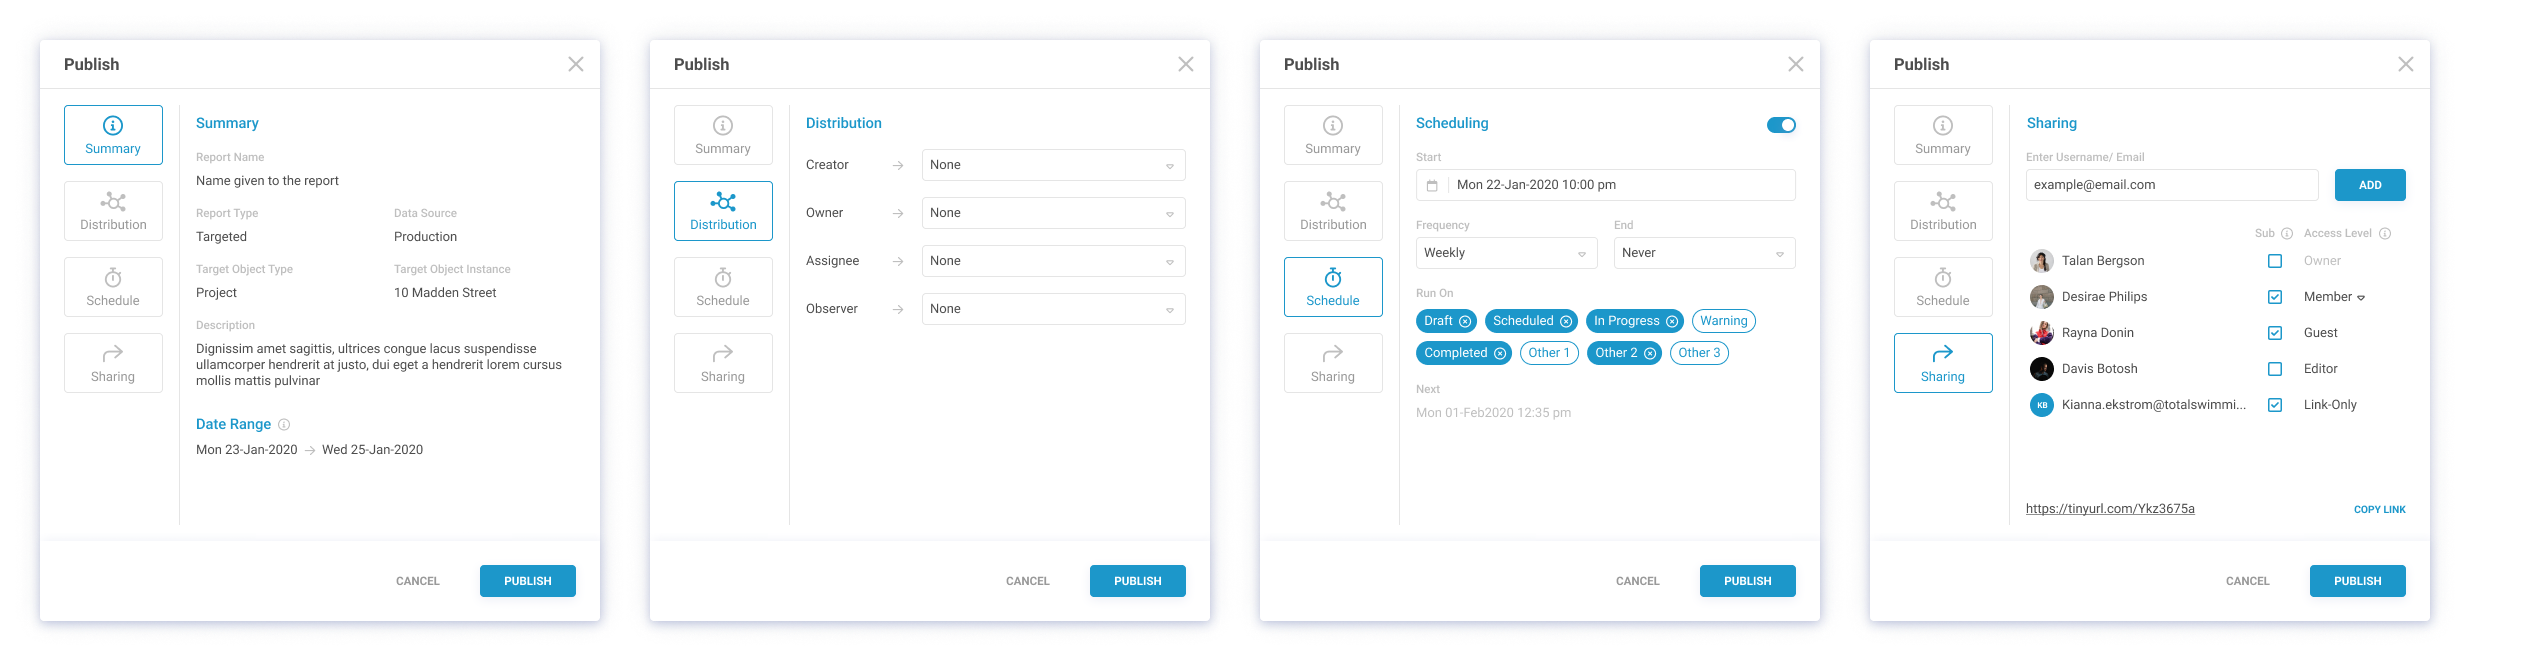
Publish Modal: Summary, Scheduling, Distribution, Sharing & Invitations
Report Imprint
Take Out
- Enhanced Decision-Making:
Centralized and accessible data improved the speed and quality of decisions. - Increased Efficiency:
Automation and user-friendly tools reduced reporting time and errors. - Improved Compliance:
Customizable reports ensured adherence to safety standards and regulations. - Scalable Solution:
The modular design allows for future growth and integration of advanced features.

My Work
Art & Design
Inside Karen


Reporting
Why is the Reporting Module Necessary?
The reporting process at Mahi Construction was fragmented and inefficient.
Existing project management tools generated massive amounts of data, but users, including Project Managers, Team Leads, and Compliance Officers struggled to extract clear insights.
This made it difficult to track progress, report constraints, and communicate effectively across teams. As a result, decision-making was delayed, reporting was error-prone, and critical issues often went unresolved on time.
Who Are We Designing For?
The reporting module is for Project Managers, Team Leads, Compliance Officers, and Executives, each with unique needs: tracking progress, monitoring performance, ensuring compliance, and evaluating project health.
Meet Project Manager
Age: 30 - 45
Role: Project Manager in Construction and Operations
Profile:
Manages project timelines, resources, and task performance to keep projects on track.
Pain Points:
- Difficulty consolidating data from multiple modules.
- Limited flexibility with static reports.
- Struggles to extract actionable insights.
- Time-consuming manual reporting.
Meet Team Lead
Age: 28 - 50
Role: Team Supervisor or Shift Manager
Profile:
Oversees team performance, shift schedules, and daily task assignments.
Pain Points:
- Lacks technical skills to generate reports.
- Difficulty monitoring team progress efficiently.
- Challenges in sharing clear performance updates.
- Limited options for customizing team-specific reports.
Meet Compliance Officer
Age: 35 - 50
Role: Compliance and Safety Specialist
Profile:
Ensures projects meet safety standards, regulations, and legal requirements.
Pain Points:
- Struggles to customize compliance reports.
- Tools can’t handle growing compliance data.
- Difficulty identifying risks or trends.
- Inefficient sharing of audit-ready reports.
Meet Executive
Age: 35 - 60
Role: Senior Executive or Decision-Maker
Profile:
Relies on high-level summaries and KPIs to evaluate project performance and make decisions.
Pain Points:
- Difficulty accessing unified project overviews.
- Needs quick, clear insights without digging into data.
- Delays caused by manual reporting processes.
- Reporting tools lack scalability for complex demands.
What was the business saying?
Centralized insights for better decision making
Combine data across modules (Project Management, Shift Allocation, etc.) into a unified, easy-to-access reporting interface.
Save time and reduce manual reporting effort
Automate report generation with templates and real-time updates.
Improve adoption with user-friendly design
Offer a simple report builder for non-technical and advanced users.
Support compliance and transparency
Generate customizable reports to meet regulatory needs.
Enhance scalability and future growth
Start with core features and scale to advanced reporting capabilities.
Research and Competitor Analysis: Mapping Goals and Prioritizing Features
The goals of the indirect competitor systems research were to analyze reporting modules and explore functionalities related to data builders.
The findings from this detailed analysis focused on identifying opportunities, mapping goals, and prioritizing features.
This research bridges the gap between end-user needs and business objectives, ensuring the reporting module aligns with both usability and strategic value.
Defining The MVP
Based on competitor research, end-user pain points, and business objectives, we applied the Impact vs. Effort framework to prioritize features. This method helped us identify key design priorities for the MVP and phase out complex features for the future roadmap.
Development Effort
Impact
Hight Impact
Low Impact
Low Effort
High Effort
Execution
Project
A Task
Remove in MVP Phase


External Data Import
Data Layout Designer
Customized Data Visualizations
Conditional formatting
Scheduled Reports
Interactive Chart Drill-Downs
Cross-Module Data Integration
Advanced Filtering and Grouping
Pivot Table Builder
Basic Reporting actions (Save Draft, Preview, Export, Share, Reuse Edit )
Role-Based Access Control
Report Version History
Real-Time Collaboration on Reports
Automated Report Emailing
Embedded Reports for Third-Party Platforms
Real-Time Data Refresh
What Have We Found from Competitors That Can Bridge Business Objectives and End User Needs?
ICRA: Features and Opportunities
- Role-Based Access Control
- Data Layout Designer
- Pivot Table Builder
- Customized Data Visualizations
- Cross-Module Data Integration
- Advanced Filtering and Grouping
- Real-Time Data Refresh
- External Data Import
- Scheduled Reports
- Conditional formatting
- Interactive Chart Drill-Downs
- Basic Reporting actions (Save Draft, Preview, Export, Share, Reuse Edit )
- Report Version History
- Real-Time Collaboration on Reports
- Automated Report Emailing
- Embedded Reports for Third-Party Platforms

Impact vs Effort Prioritization
- Role-Based Access Control
- Custom Data Builder
- Customizable Data Visualizations
- Cross-Module Data Integration
- Advanced Filtering and Grouping
- Real-Time Data Refresh
- Scheduled Reports
- Conditional Formatting
- Interactive Chart Drill-Down
- Basic Reporting Actions

KPI: Final Design Elements
- Create Modal: Data Source, Report Type
- Data Builder: Layout, Settings, Scheduling, Summary, Chart Type Selection, Edit Chart Data, Advanced Data Filtering
- Report Preview
- Publish Modal: Summary, Scheduling, Distribution, Sharing & Invitations
- Report Imprint
- Report Status: Draft, Active, Archived
Flows, Wireframes, and Whiteboard Section
We started with a high-level Information Architecture (IA) to establish the reporting module's structure, followed by developing user journeys to map the experience across key tasks.This was supported by a dynamic process that combined user flows, detailed wireframes, and notes for feature logic.
The result bridges the gap between flowcharts and wireframes, documenting feature behaviors, user interactions, and logical connections.
This approach ensures a clear, seamless, and intuitive experience for users as they navigate through report creation, customization, and management.
Access Management (Inventory)


Project Managers
Executives

Construction Team Leaders

Compliance Officers
Login
(Azure Active Directory Azure AD )


Reports Center
Planner (Gant Chart)


Create Report
Define data source
Select report type
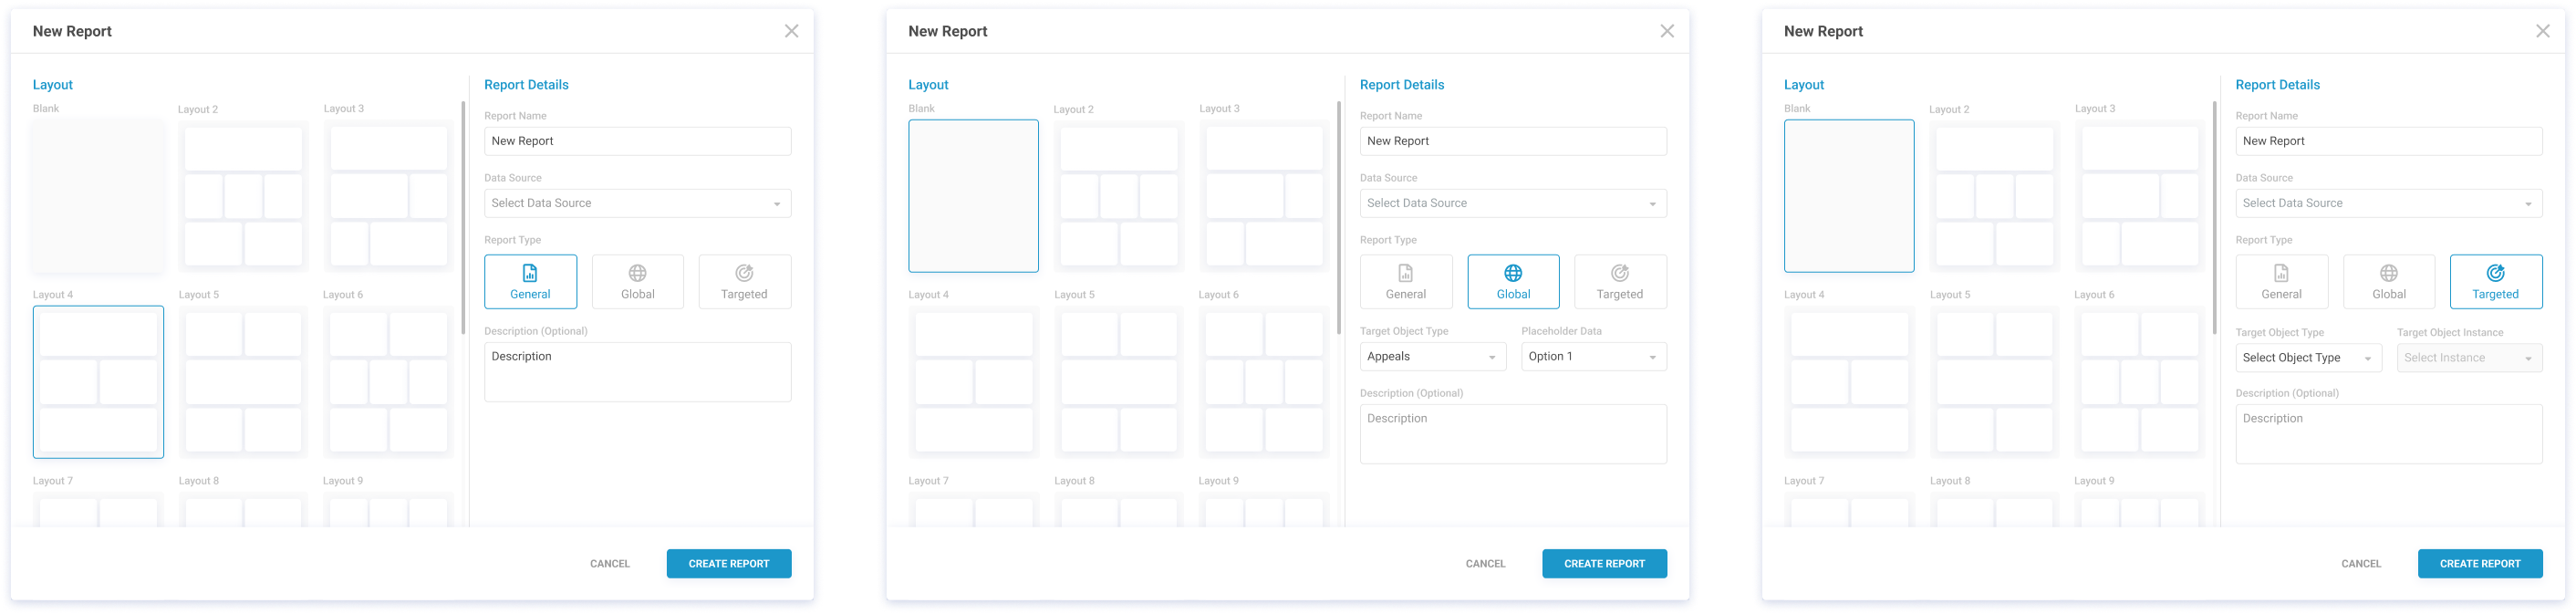
General
Global
Targeted
Chart types
Data Editor
Date range
Report Description
Report Name
Report Layout
Save and Scheduling
Data Builder
Drag-and-drop layout builder
Chart customization options
Advanced filtering tools
Scheduling options for reports
Summary view of report content
Report Preview
Finalized look at report sections and charts
Direct adjustments from preview
Publish Modal
Finalize report distribution
Summary confirmation before publishing
Recipient management for report sharing
Recipient management for report sharing
Options for export formats (PDF/Excel)
Options for export formats (PDF/Excel)
Sending invitations for collaboration
Report Imprint
Customize logos and headers
Add metadata (date, author, version history)
Report Status Management
Categorize reports (Draft, Active, Archived)
Manage accessibility of each report status


UI and Hi-Fi design
Create Modal: Data Source, Report Type
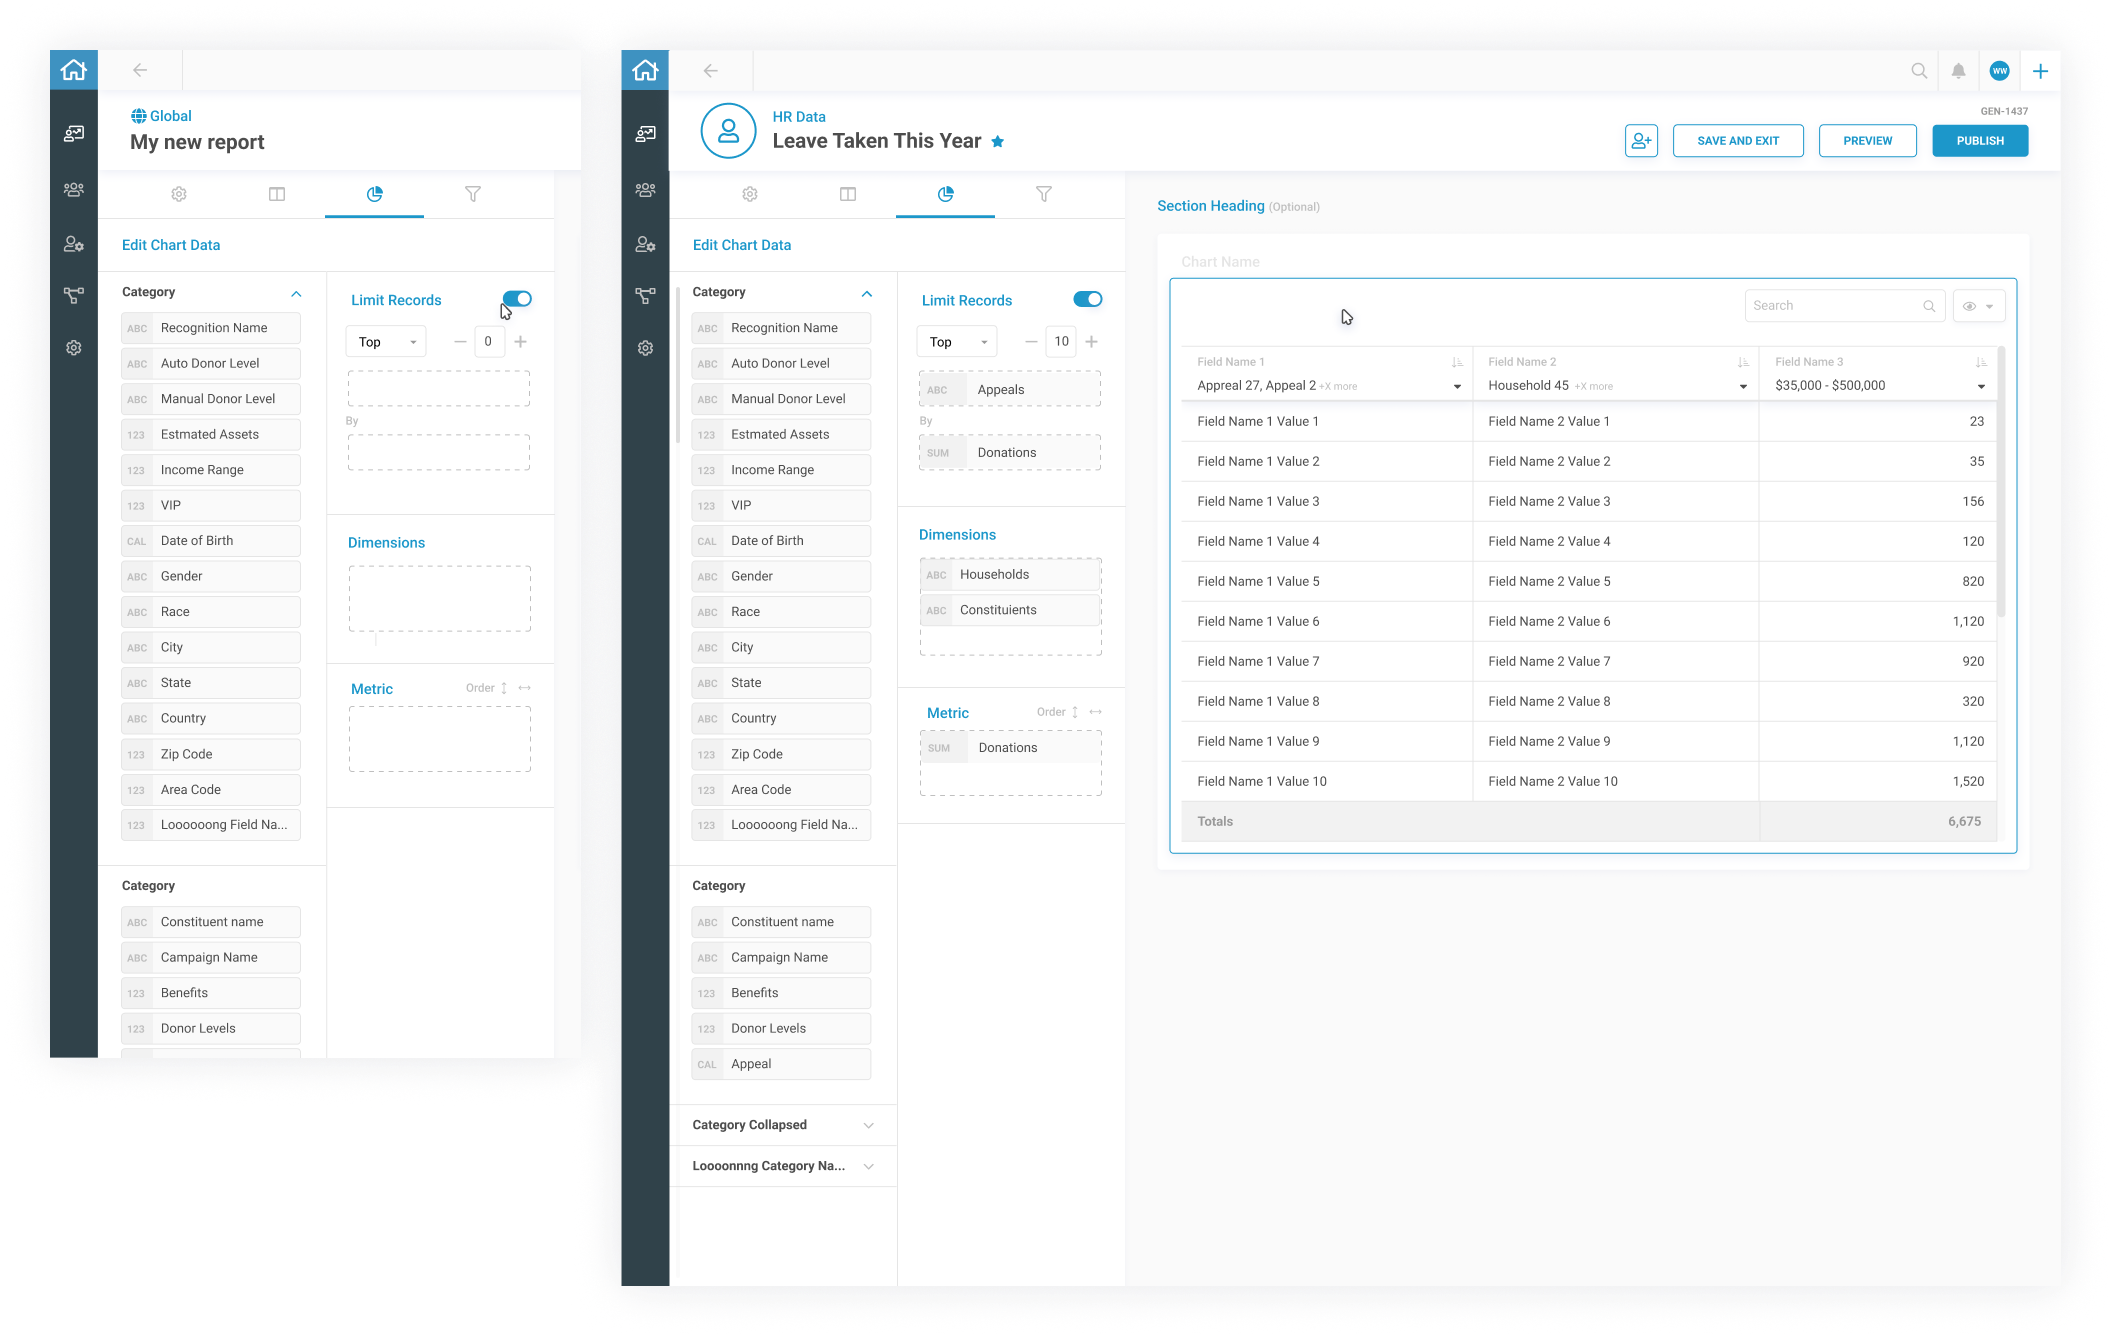
Data Builder: Layout
Data Builder: Settings, Scheduling, and Summary
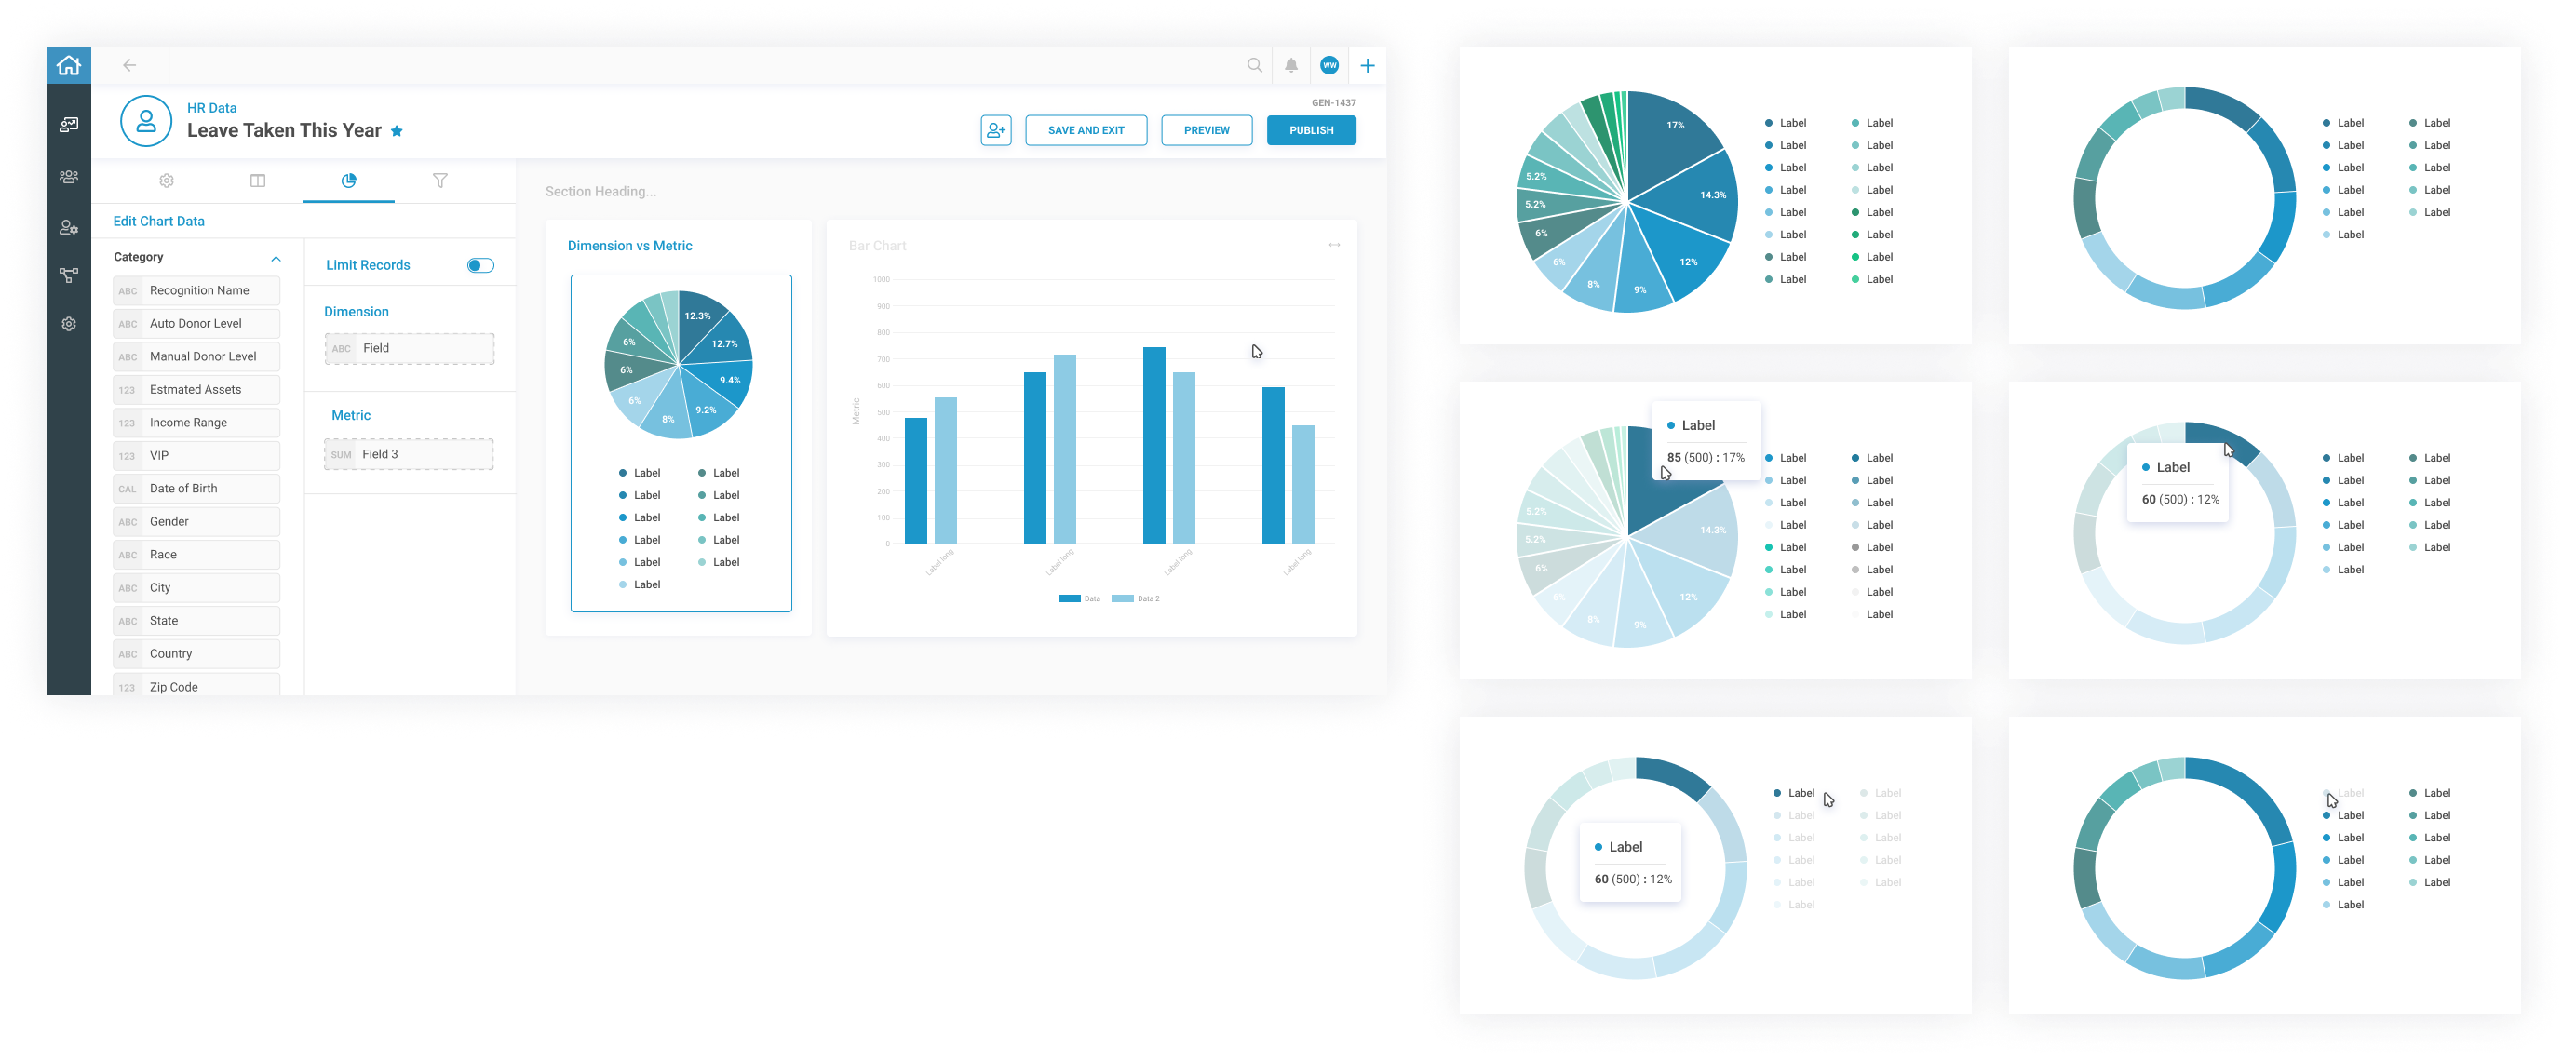
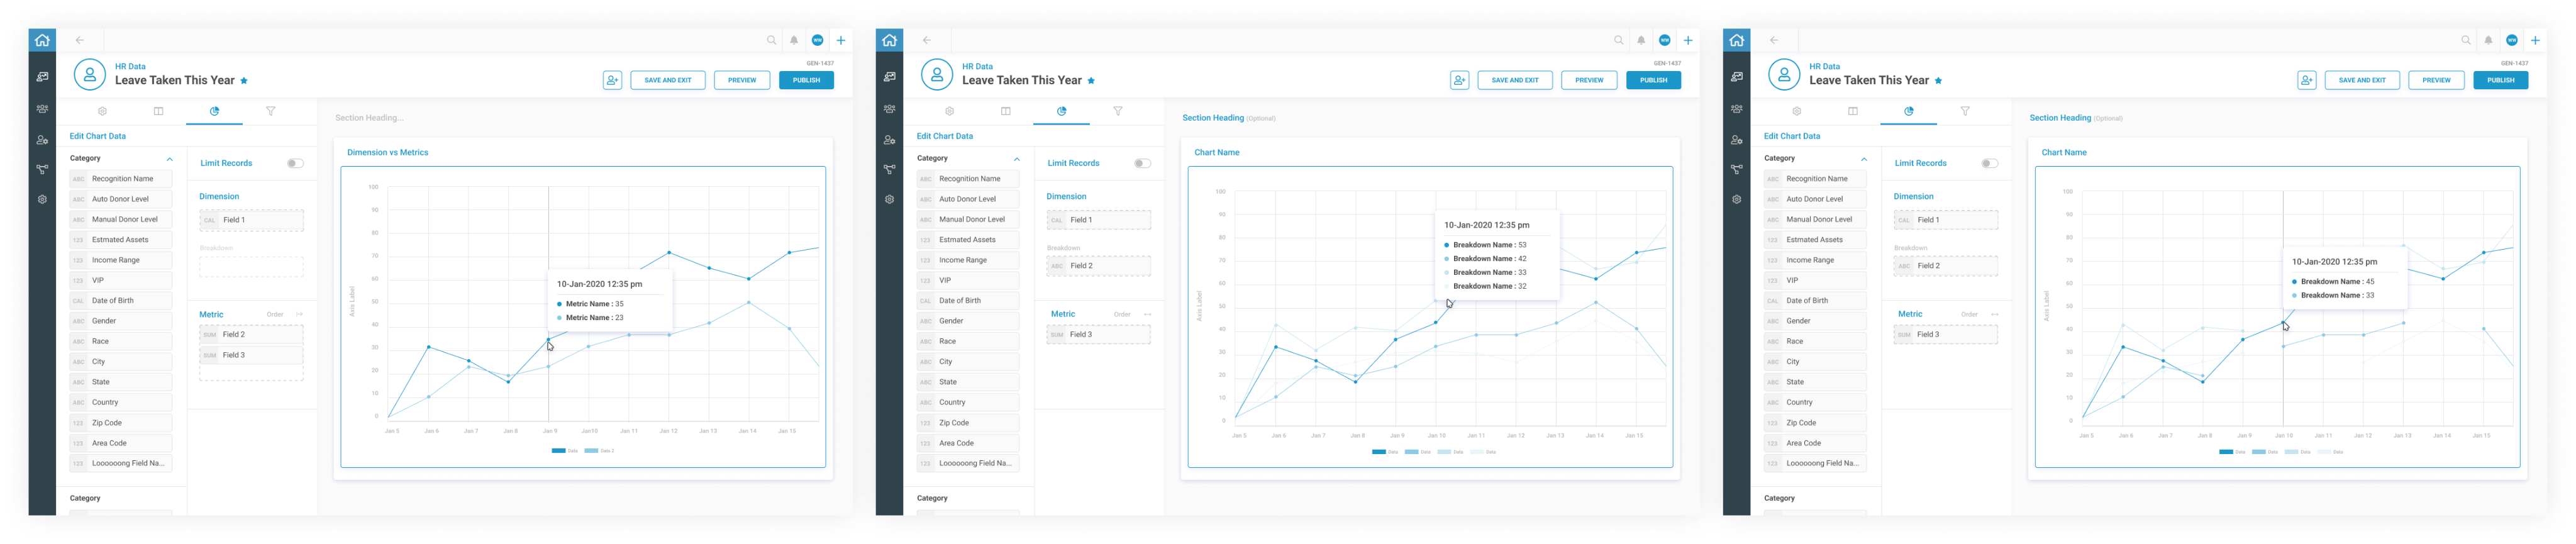
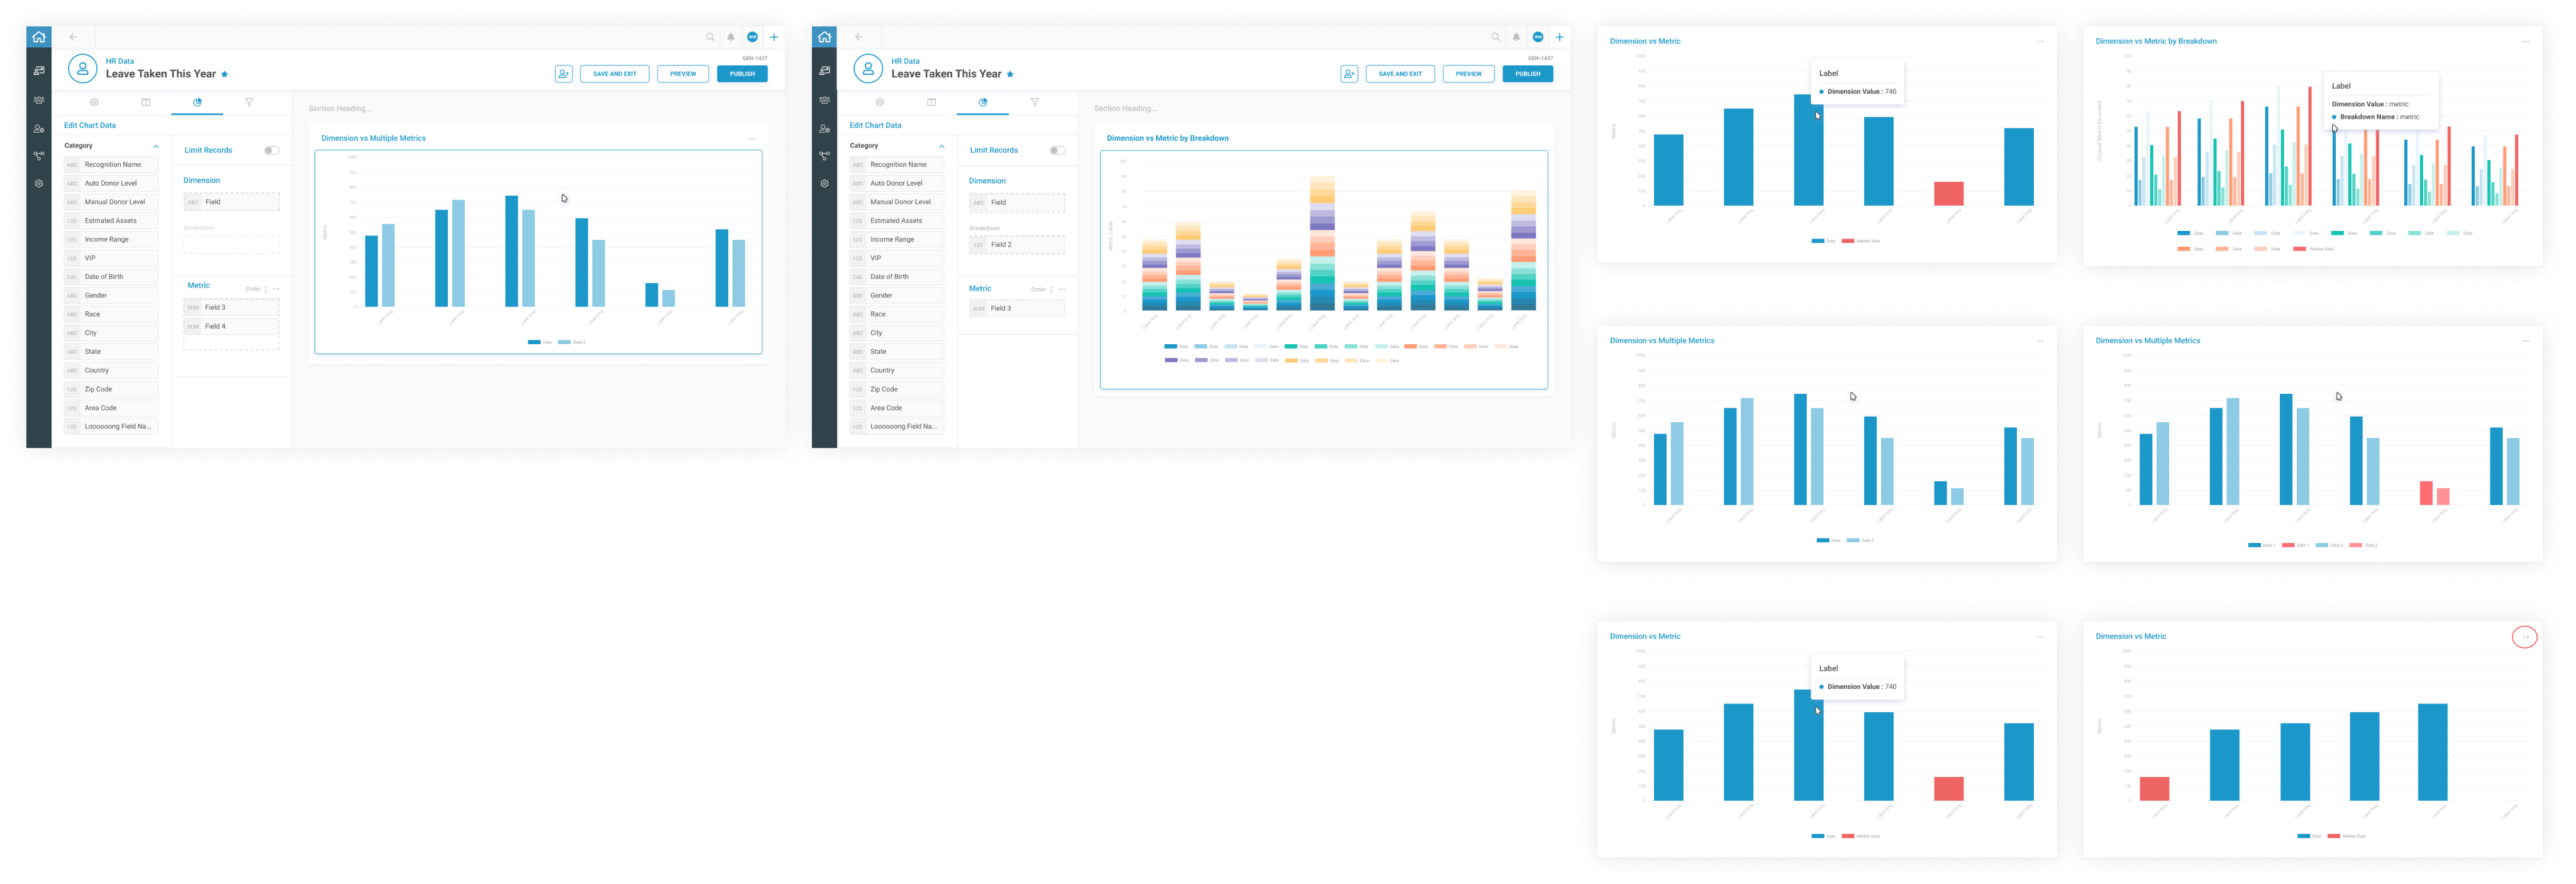
Data Builder: Data Chart Type Selection
Data Builder: Advance Data Filtering
Publish Modal: Summary, Scheduling, Distribution, Sharing & Invitations
Report Imprint
Take Out
- Enhanced Decision-Making:
Centralized and accessible data improved the speed and quality of decisions. - Increased Efficiency:
Automation and user-friendly tools reduced reporting time and errors. - Improved Compliance:
Customizable reports ensured adherence to safety standards and regulations. - Scalable Solution:
The modular design allows for future growth and integration of advanced features.
My Work
Art & Design
Inside Karen
Reporting
Why is the Reporting Module Necessary?
The reporting process at Mahi Construction was fragmented and inefficient.
Existing project management tools generated massive amounts of data, but users, including Project Managers, Team Leads, and Compliance Officers struggled to extract clear insights.
This made it difficult to track progress, report constraints, and communicate effectively across teams. As a result, decision-making was delayed, reporting was error-prone, and critical issues often went unresolved on time.
Who Are We Designing For?
The reporting module is for Project Managers, Team Leads, Compliance Officers, and Executives, each with unique needs: tracking progress, monitoring performance, ensuring compliance, and evaluating project health.
Meet Project Manager
Age: 30 - 45
Role: Project Manager in Construction and Operations
Profile:
Manages project timelines, resources, and task performance to keep projects on track.
Pain Points:
- Difficulty consolidating data from multiple modules.
- Limited flexibility with static reports.
- Struggles to extract actionable insights.
- Time-consuming manual reporting.
Meet Team Lead
Age: 28 - 50
Role: Team Supervisor or Shift Manager
Profile:
Oversees team performance, shift schedules, and daily task assignments.
Pain Points:
- Lacks technical skills to generate reports.
- Difficulty monitoring team progress efficiently.
- Challenges in sharing clear performance updates.
- Limited options for customizing team-specific reports.
Meet Compliance Officer
Age: 35 - 50
Role: Compliance and Safety Specialist
Profile:
Ensures projects meet safety standards, regulations, and legal requirements.
Pain Points:
- Struggles to customize compliance reports.
- Tools can’t handle growing compliance data.
- Difficulty identifying risks or trends.
- Inefficient sharing of audit-ready reports.
Meet Executive
Age: 35 - 60
Role: Senior Executive or Decision-Maker
Profile:
Relies on high-level summaries and KPIs to evaluate project performance and make decisions.
Pain Points:
- Difficulty accessing unified project overviews.
- Needs quick, clear insights without digging into data.
- Delays caused by manual reporting processes.
- Reporting tools lack scalability for complex demands.
What was the business saying?
Centralized insights for better decision making
Combine data across modules (Project Management, Shift Allocation, etc.) into a unified, easy-to-access reporting interface.
Save time and reduce manual reporting effort
Automate report generation with templates and real-time updates.
Improve adoption with user-friendly design
Offer a simple report builder for non-technical and advanced users.
Support compliance and transparency
Generate customizable reports to meet regulatory needs.
Enhance scalability and future growth
Start with core features and scale to advanced reporting capabilities.
Research and Competitor Analysis: Mapping Goals and Prioritizing Features
The goals of the indirect competitor systems research were to analyze reporting modules and explore functionalities related to data builders.
The findings from this detailed analysis focused on identifying opportunities, mapping goals, and prioritizing features.
This research bridges the gap between end-user needs and business objectives, ensuring the reporting module aligns with both usability and strategic value.
Defining The MVP
Based on competitor research, end-user pain points, and business objectives, we applied the Impact vs. Effort framework to prioritize features. This method helped us identify key design priorities for the MVP and phase out complex features for the future roadmap.
Development Effort
Impact
Hight Impact
Low Impact
Low Effort
High Effort
Execution
Project
A Task
Remove in MVP Phase
External Data Import
Data Layout Designer
Customized Data Visualizations
Conditional formatting
Scheduled Reports
Interactive Chart Drill-Downs
Cross-Module Data Integration
Advanced Filtering and Grouping
Pivot Table Builder
Basic Reporting actions (Save Draft, Preview, Export, Share, Reuse Edit )
Role-Based Access Control
Report Version History
Real-Time Collaboration on Reports
Automated Report Emailing
Embedded Reports for Third-Party Platforms
Real-Time Data Refresh
What Have We Found from Competitors That Can Bridge Business Objectives and End User Needs?
ICRA: Features and Opportunities
- Role-Based Access Control
- Data Layout Designer
- Pivot Table Builder
- Customized Data Visualizations
- Cross-Module Data Integration
- Advanced Filtering and Grouping
- Real-Time Data Refresh
- External Data Import
- Scheduled Reports
- Conditional formatting
- Interactive Chart Drill-Downs
- Basic Reporting actions (Save Draft, Preview, Export, Share, Reuse Edit )
- Report Version History
- Real-Time Collaboration on Reports
- Automated Report Emailing
- Embedded Reports for Third-Party Platforms

Impact vs Effort Prioritization
- Role-Based Access Control
- Custom Data Builder
- Customizable Data Visualizations
- Cross-Module Data Integration
- Advanced Filtering and Grouping
- Real-Time Data Refresh
- Scheduled Reports
- Conditional Formatting
- Interactive Chart Drill-Down
- Basic Reporting Actions
KPI: Final Design Elements
- Create Modal: Data Source, Report Type
- Data Builder: Layout, Settings, Scheduling, Summary, Chart Type Selection, Edit Chart Data, Advanced Data Filtering
- Report Preview
- Publish Modal: Summary, Scheduling, Distribution, Sharing & Invitations
- Report Imprint
- Report Status: Draft, Active, Archived
Flows, Wireframes, and Whiteboard Section
We started with a high-level Information Architecture (IA) to establish the reporting module's structure, followed by developing user journeys to map the experience across key tasks.This was supported by a dynamic process that combined user flows, detailed wireframes, and notes for feature logic.
The result bridges the gap between flowcharts and wireframes, documenting feature behaviors, user interactions, and logical connections.
This approach ensures a clear, seamless, and intuitive experience for users as they navigate through report creation, customization, and management.
Access Management (Inventory)
Project Managers
Executives
Construction Team Leaders
Compliance Officers
Login
(Azure Active Directory Azure AD )
Reports Center
Planner (Gant Chart)
Create Report
Define data source
Select report type
General
Global
Targeted
Chart types
Data Editor
Date range
Report Description
Report Name
Report Layout
Save and Scheduling
Data Builder
Drag-and-drop layout builder
Chart customization options
Advanced filtering tools
Scheduling options for reports
Summary view of report content
Report Preview
Finalized look at report sections and charts
Direct adjustments from preview
Publish Modal
Finalize report distribution
Summary confirmation before publishing
Recipient management for report sharing
Recipient management for report sharing
Options for export formats (PDF/Excel)
Options for export formats (PDF/Excel)
Sending invitations for collaboration
Report Imprint
Customize logos and headers
Add metadata (date, author, version history)
Report Status Management
Categorize reports (Draft, Active, Archived)
Manage accessibility of each report status
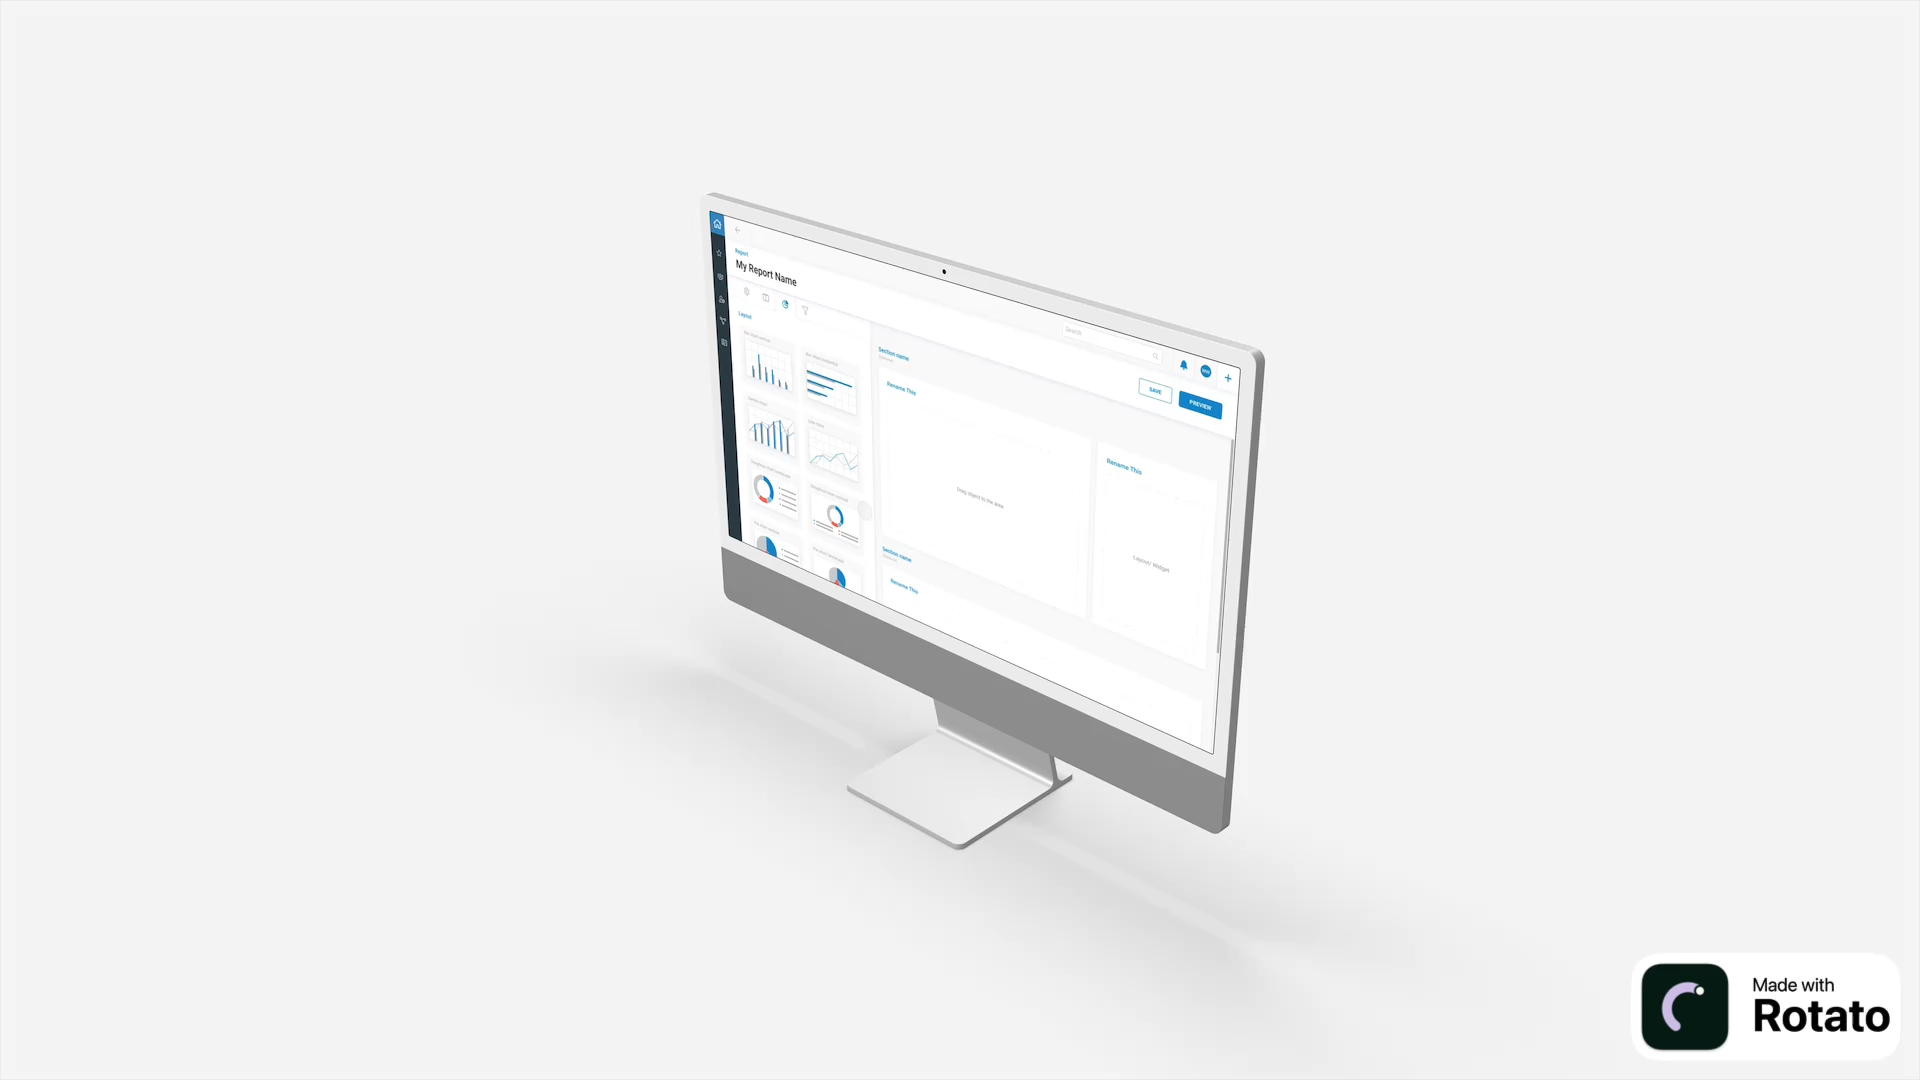
UI and Hi-Fi design
Create Modal: Data Source, Report Type
Data Builder: Layout
Data Builder: Settings, Scheduling, and Summary
Data Builder: Data Chart Type Selection
Data Builder: Advance Data Filtering
Publish Modal: Summary, Scheduling, Distribution, Sharing & Invitations
Report Imprint
Take Out
- Enhanced Decision-Making:
Centralized and accessible data improved the speed and quality of decisions. - Increased Efficiency:
Automation and user-friendly tools reduced reporting time and errors. - Improved Compliance:
Customizable reports ensured adherence to safety standards and regulations. - Scalable Solution:
The modular design allows for future growth and integration of advanced features.
My Work
Art & Design
Inside Karen
Reporting
Why is the Reporting Module Necessary?
The reporting process at Mahi Construction was fragmented and inefficient.
Existing project management tools generated massive amounts of data, but users, including Project Managers, Team Leads, and Compliance Officers struggled to extract clear insights.
This made it difficult to track progress, report constraints, and communicate effectively across teams. As a result, decision-making was delayed, reporting was error-prone, and critical issues often went unresolved on time.
Who Are We Designing For?
The reporting module is for Project Managers, Team Leads, Compliance Officers, and Executives, each with unique needs: tracking progress, monitoring performance, ensuring compliance, and evaluating project health.
Meet Project Manager
Age: 30 - 45
Role: Project Manager in Construction and Operations
Profile:
Manages project timelines, resources, and task performance to keep projects on track.
Pain Points:
- Difficulty consolidating data from multiple modules.
- Limited flexibility with static reports.
- Struggles to extract actionable insights.
- Time-consuming manual reporting.
Meet Team Lead
Age: 28 - 50
Role: Team Supervisor or Shift Manager
Profile:
Oversees team performance, shift schedules, and daily task assignments.
Pain Points:
- Lacks technical skills to generate reports.
- Difficulty monitoring team progress efficiently.
- Challenges in sharing clear performance updates.
- Limited options for customizing team-specific reports.
Meet Compliance Officer
Age: 35 - 50
Role: Compliance and Safety Specialist
Profile:
Ensures projects meet safety standards, regulations, and legal requirements.
Pain Points:
- Struggles to customize compliance reports.
- Tools can’t handle growing compliance data.
- Difficulty identifying risks or trends.
- Inefficient sharing of audit-ready reports.
Meet Executive
Age: 35 - 60
Role: Senior Executive or Decision-Maker
Profile:
Relies on high-level summaries and KPIs to evaluate project performance and make decisions.
Pain Points:
- Difficulty accessing unified project overviews.
- Needs quick, clear insights without digging into data.
- Delays caused by manual reporting processes.
- Reporting tools lack scalability for complex demands.
What was the business saying?
Centralized insights for better decision making
Combine data across modules (Project Management, Shift Allocation, etc.) into a unified, easy-to-access reporting interface.
Save time and reduce manual reporting effort
Automate report generation with templates and real-time updates.
Improve adoption with user-friendly design
Offer a simple report builder for non-technical and advanced users.
Support compliance and transparency
Generate customizable reports to meet regulatory needs.
Enhance scalability and future growth
Start with core features and scale to advanced reporting capabilities.
Research and Competitor Analysis: Mapping Goals and Prioritizing Features
The goals of the indirect competitor systems research were to analyze reporting modules and explore functionalities related to data builders.
The findings from this detailed analysis focused on identifying opportunities, mapping goals, and prioritizing features.
This research bridges the gap between end-user needs and business objectives, ensuring the reporting module aligns with both usability and strategic value.
Defining The MVP
Based on competitor research, end-user pain points, and business objectives, we applied the Impact vs. Effort framework to prioritize features. This method helped us identify key design priorities for the MVP and phase out complex features for the future roadmap.
Development Effort
Impact
Hight Impact
Low Impact
Low Effort
High Effort
Execution
Project
A Task
Remove in MVP Phase
External Data Import
Data Layout Designer
Customized Data Visualizations
Conditional formatting
Scheduled Reports
Interactive Chart Drill-Downs
Cross-Module Data Integration
Advanced Filtering and Grouping
Pivot Table Builder
Basic Reporting actions (Save Draft, Preview, Export, Share, Reuse Edit )
Role-Based Access Control
Report Version History
Real-Time Collaboration on Reports
Automated Report Emailing
Embedded Reports for Third-Party Platforms
Real-Time Data Refresh
What Have We Found from Competitors That Can Bridge Business Objectives and End User Needs?
ICRA: Features and Opportunities
- Role-Based Access Control
- Data Layout Designer
- Pivot Table Builder
- Customized Data Visualizations
- Cross-Module Data Integration
- Advanced Filtering and Grouping
- Real-Time Data Refresh
- External Data Import
- Scheduled Reports
- Conditional formatting
- Interactive Chart Drill-Downs
- Basic Reporting actions (Save Draft, Preview, Export, Share, Reuse Edit )
- Report Version History
- Real-Time Collaboration on Reports
- Automated Report Emailing
- Embedded Reports for Third-Party Platforms
Impact vs Effort Prioritization
- Role-Based Access Control
- Custom Data Builder
- Customizable Data Visualizations
- Cross-Module Data Integration
- Advanced Filtering and Grouping
- Real-Time Data Refresh
- Scheduled Reports
- Conditional Formatting
- Interactive Chart Drill-Down
- Basic Reporting Actions
KPI: Final Design Elements
- Create Modal: Data Source, Report Type
- Data Builder: Layout, Settings, Scheduling, Summary, Chart Type Selection, Edit Chart Data, Advanced Data Filtering
- Report Preview
- Publish Modal: Summary, Scheduling, Distribution, Sharing & Invitations
- Report Imprint
- Report Status: Draft, Active, Archived
Flows, Wireframes, and Whiteboard Section
We started with a high-level Information Architecture (IA) to establish the reporting module's structure, followed by developing user journeys to map the experience across key tasks.This was supported by a dynamic process that combined user flows, detailed wireframes, and notes for feature logic.
The result bridges the gap between flowcharts and wireframes, documenting feature behaviors, user interactions, and logical connections.
This approach ensures a clear, seamless, and intuitive experience for users as they navigate through report creation, customization, and management.
Access Management (Inventory)
Project Managers
Executives
Construction Team Leaders
Compliance Officers
Login
(Azure Active Directory Azure AD )
Reports Center
Planner (Gant Chart)
Create Report
Define data source
Select report type
General
Global
Targeted
Chart types
Data Editor
Date range
Report Description
Report Name
Report Layout
Save and Scheduling
Data Builder
Drag-and-drop layout builder
Chart customization options
Advanced filtering tools
Scheduling options for reports
Summary view of report content
Report Preview
Finalized look at report sections and charts
Direct adjustments from preview
Publish Modal
Finalize report distribution
Summary confirmation before publishing
Recipient management for report sharing
Recipient management for report sharing
Options for export formats (PDF/Excel)
Options for export formats (PDF/Excel)
Sending invitations for collaboration
Report Imprint
Customize logos and headers
Add metadata (date, author, version history)
Report Status Management
Categorize reports (Draft, Active, Archived)
Manage accessibility of each report status
UI and Hi-Fi design
Create Modal: Data Source, Report Type
Data Builder: Layout
Data Builder: Settings, Scheduling, and Summary
Data Builder: Data Chart Type Selection
Data Builder: Advance Data Filtering
Publish Modal: Summary, Scheduling, Distribution, Sharing & Invitations
Report Imprint
Take Out
- Enhanced Decision-Making:
Centralized and accessible data improved the speed and quality of decisions. - Increased Efficiency:
Automation and user-friendly tools reduced reporting time and errors. - Improved Compliance:
Customizable reports ensured adherence to safety standards and regulations. - Scalable Solution:
The modular design allows for future growth and integration of advanced features.
My Work
Art & Design
Inside Karen